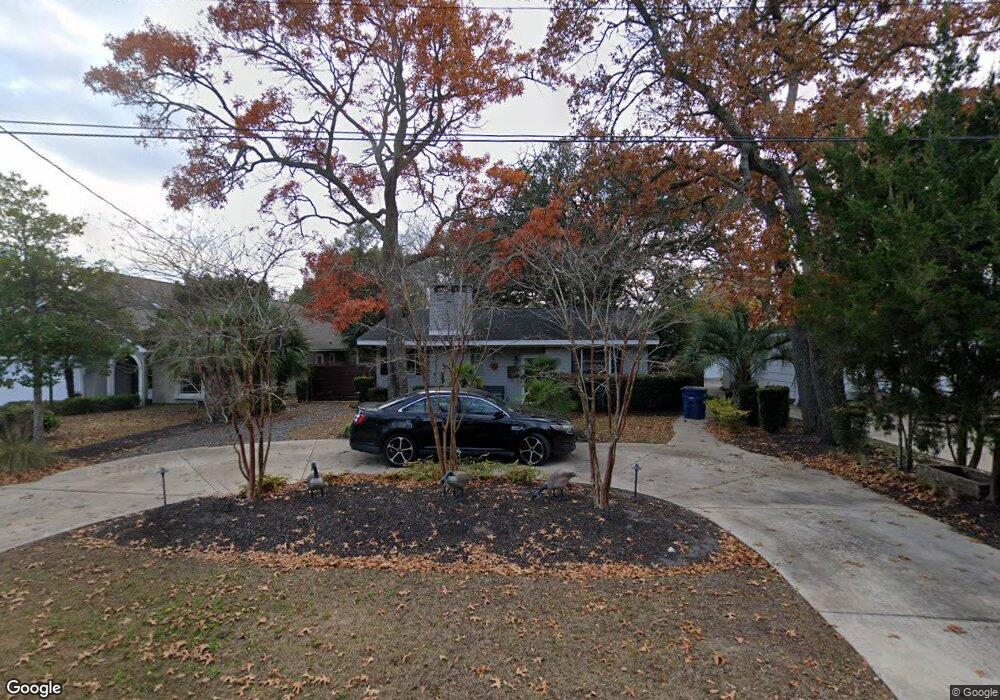
313 N Highland Way Unit Highlands Myrtle Beach, SC 29572
Grande Dunes NeighborhoodEstimated Value: $632,132 - $654,000
2
Beds
2
Baths
1,669
Sq Ft
$382/Sq Ft
Est. Value
About This Home
This home is located at 313 N Highland Way Unit Highlands, Myrtle Beach, SC 29572 and is currently estimated at $638,033, approximately $382 per square foot. 313 N Highland Way Unit Highlands is a home located in Horry County with nearby schools including Myrtle Beach Child Development Center, Myrtle Beach Primary School, and Myrtle Beach Elementary School.
Ownership History
Date
Name
Owned For
Owner Type
Purchase Details
Closed on
Nov 5, 2025
Sold by
Polston Misty D
Bought by
Polston Misty D
Current Estimated Value
Purchase Details
Closed on
Apr 25, 2018
Sold by
Macho Brian
Bought by
Polston Misty D
Home Financials for this Owner
Home Financials are based on the most recent Mortgage that was taken out on this home.
Original Mortgage
$356,250
Interest Rate
4.44%
Mortgage Type
New Conventional
Purchase Details
Closed on
Nov 22, 2013
Sold by
Pokorney Jana L
Bought by
Macho Brian
Purchase Details
Closed on
Jul 30, 2010
Sold by
Littlejohn Janet M
Bought by
Pokorney Jana L
Purchase Details
Closed on
Jul 16, 2010
Sold by
Littlejohn William L
Bought by
Littlejohn Janet M
Purchase Details
Closed on
Nov 27, 2007
Sold by
Littlejohn Janet M
Bought by
Pokorney Jana L
Create a Home Valuation Report for This Property
The Home Valuation Report is an in-depth analysis detailing your home's value as well as a comparison with similar homes in the area
Home Values in the Area
Average Home Value in this Area
Purchase History
| Date | Buyer | Sale Price | Title Company |
|---|---|---|---|
| Polston Misty D | $575,000 | -- | |
| Polston Misty D | $375,000 | -- | |
| Macho Brian | $187,500 | -- | |
| Macho Brian | $187,500 | -- | |
| Pokorney Jana L | -- | -- | |
| Littlejohn Janet M | -- | -- | |
| Pokorney Jana L | -- | None Available |
Source: Public Records
Mortgage History
| Date | Status | Borrower | Loan Amount |
|---|---|---|---|
| Previous Owner | Polston Misty D | $356,250 |
Source: Public Records
Tax History Compared to Growth
Tax History
| Year | Tax Paid | Tax Assessment Tax Assessment Total Assessment is a certain percentage of the fair market value that is determined by local assessors to be the total taxable value of land and additions on the property. | Land | Improvement |
|---|---|---|---|---|
| 2024 | $0 | $37,667 | $24,000 | $13,667 |
| 2023 | $6,599 | $15,028 | $6,804 | $8,224 |
| 2021 | $1,384 | $15,028 | $6,804 | $8,224 |
| 2020 | $1,197 | $15,028 | $6,804 | $8,224 |
| 2019 | $1,151 | $15,028 | $6,804 | $8,224 |
| 2018 | $766 | $14,609 | $8,699 | $5,910 |
| 2017 | $0 | $9,740 | $5,800 | $3,940 |
| 2016 | $0 | $9,740 | $5,800 | $3,940 |
| 2015 | -- | $9,740 | $5,800 | $3,940 |
| 2014 | $664 | $9,740 | $5,800 | $3,940 |
Source: Public Records
Map
Nearby Homes
- 409 N Highland Way
- 407 N Highland Way
- 406 63rd Ave N
- 409 64th Ave N
- 505 63rd Ave N
- 6307 Wildwood Trail Unit A
- 6307 Wildwood Trail Unit C
- 605 62nd Ave N
- 5723 N Kings Hwy Unit Site 5723
- 6510 Wildwood Trail Unit 8
- 6601 N Ocean Blvd
- 6306 Somerset Dr
- 5817 Sumter Dr
- 5704 N Kings Hwy
- 600 65th Ave N Unit 7
- 5706 Porcher Dr
- 703 62nd Ave N
- 5811 Sumter Dr
- 6624 Lagoon Place
- TBD 67th Ave N
- 401 N Highland Way
- 311 N Highland Way
- 311N N Highland Way
- 405 N Highland Way Unit Lot 30
- 409 N Highland Way Unit Lot 32
- 407 N Highland Way Unit Lot 31
- 403 N Highland Way
- 309 N Highland Way
- 117 S Highland Way
- 201 S Highland Way
- 115 S Highland Way
- 307 N Highland Way
- 203S S Highland Way
- 111 S Highland Way
- 400 N Highland Way
- 205 S Highland Way
- 402 N Highland Way
- 320 N Highland Way
- 404 N Highland Way
- 0 S Highland Way