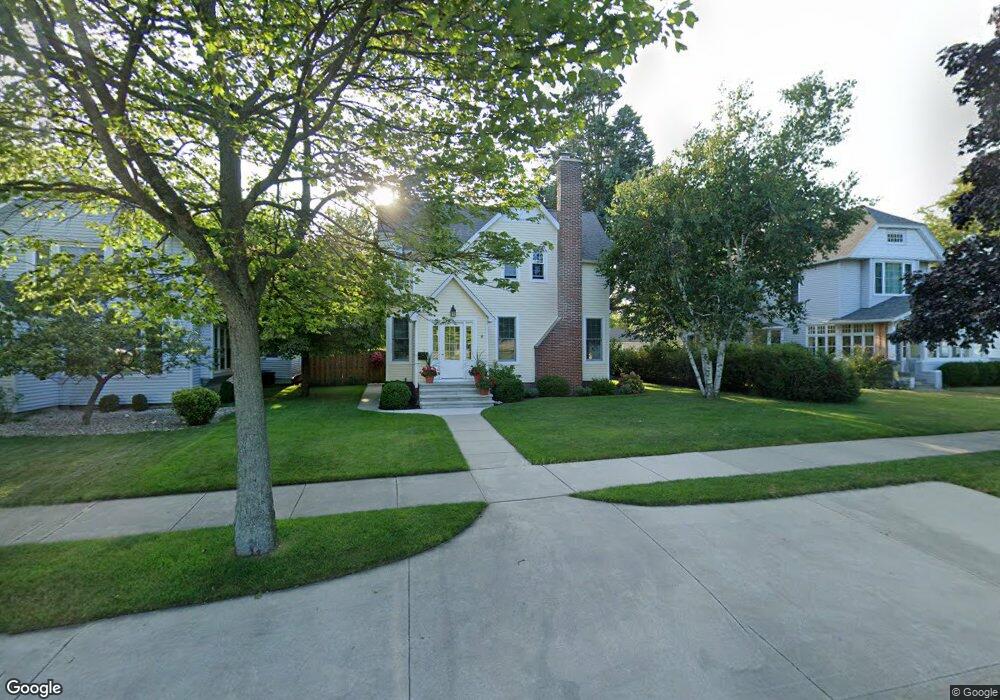
313 N James St Ludington, MI 49431
Estimated Value: $304,000 - $405,000
3
Beds
2
Baths
2,475
Sq Ft
$142/Sq Ft
Est. Value
About This Home
This home is located at 313 N James St, Ludington, MI 49431 and is currently estimated at $350,230, approximately $141 per square foot. 313 N James St is a home located in Mason County with nearby schools including Ludington Elementary School, Franklin Elementary School, and O.J. DeJonge Middle School.
Ownership History
Date
Name
Owned For
Owner Type
Purchase Details
Closed on
Sep 20, 2011
Sold by
Matson Re Llc
Bought by
Fournier Cary and Fournier Mary Ann
Current Estimated Value
Home Financials for this Owner
Home Financials are based on the most recent Mortgage that was taken out on this home.
Original Mortgage
$78,750
Outstanding Balance
$51,931
Interest Rate
3.5%
Mortgage Type
Adjustable Rate Mortgage/ARM
Estimated Equity
$298,299
Purchase Details
Closed on
Jan 15, 2011
Sold by
Matson Brian J and Matson Lynda S
Bought by
Matson Re Llc
Purchase Details
Closed on
Dec 13, 2010
Sold by
Deutsche Bank National Trust
Bought by
Matson Brian J
Purchase Details
Closed on
Nov 5, 2009
Sold by
Boitel Jennifer and Boitel Leonardo
Bought by
Deutsche Bank National Trust Company
Purchase Details
Closed on
Jul 18, 2002
Sold by
Washburn Roger and Washburn Jane F
Bought by
Boitel Leonardo A and Boitel Jennifer H
Purchase Details
Closed on
Jun 1, 1999
Sold by
Sleeman Daniel G and Sleeman Ann M
Bought by
Washburn Roger and Washburn Jane F
Create a Home Valuation Report for This Property
The Home Valuation Report is an in-depth analysis detailing your home's value as well as a comparison with similar homes in the area
Home Values in the Area
Average Home Value in this Area
Purchase History
| Date | Buyer | Sale Price | Title Company |
|---|---|---|---|
| Fournier Cary | $87,500 | None Available | |
| Matson Re Llc | -- | None Available | |
| Matson Brian J | $59,900 | -- | |
| Deutsche Bank National Trust Company | $152,220 | None Available | |
| Boitel Leonardo A | $108,900 | -- | |
| Washburn Roger | $109,900 | -- |
Source: Public Records
Mortgage History
| Date | Status | Borrower | Loan Amount |
|---|---|---|---|
| Open | Fournier Cary | $78,750 |
Source: Public Records
Tax History Compared to Growth
Tax History
| Year | Tax Paid | Tax Assessment Tax Assessment Total Assessment is a certain percentage of the fair market value that is determined by local assessors to be the total taxable value of land and additions on the property. | Land | Improvement |
|---|---|---|---|---|
| 2025 | $3,851 | $172,700 | $172,700 | $0 |
| 2024 | -- | $158,700 | $158,700 | $0 |
| 2023 | -- | $132,100 | $132,100 | $0 |
| 2022 | -- | $113,500 | $0 | $0 |
| 2021 | -- | $106,200 | $0 | $0 |
| 2020 | -- | -- | $0 | $0 |
| 2019 | -- | -- | $0 | $0 |
| 2018 | -- | -- | $0 | $0 |
| 2017 | -- | -- | $0 | $0 |
| 2016 | -- | -- | $0 | $0 |
| 2015 | -- | -- | $0 | $0 |
| 2013 | -- | -- | $0 | $0 |
Source: Public Records
Map
Nearby Homes
- 207 N Rath Ave
- 319 N Rowe St
- 416 N Rath Ave
- 200 S Robert St Unit 54
- 420 N Robert St
- 404 W Court St
- 601 N Rath Ave
- 210 N Lavinia St
- 505 E Pere Marquette St
- 302 S James St
- 502 W Loomis St Unit Lot 11, Bk 49
- 502 W Loomis St Unit Lot 10, Bk 49
- 502 W Loomis St Unit Lot 9, Bk 49
- 502 W Loomis St Unit Lot 12, Bk 49
- 115 N Emily St
- 508 E Ludington Ave
- 413 S Rath Ave Unit Site 2
- 409 E Filer St
- 301 E Foster St
- 802 N Rath Ave
- 315 N James St
- 311 N James St
- 311 N James St Unit 5
- 317 N James St
- 309 N James St
- 307 N James St
- 319 N James St
- 310 N James St
- 312 N Rath Ave
- 314 N Rath Ave
- 316 N Rath Ave
- 318 N Rath Ave
- 310 N Rath Ave
- 321 N James St
- 103 W Haight St
- 308 N Rath Ave
- 320 N Rath Ave
- 301 N James St
- 322 N Rath Ave
- 306 N Rath Ave