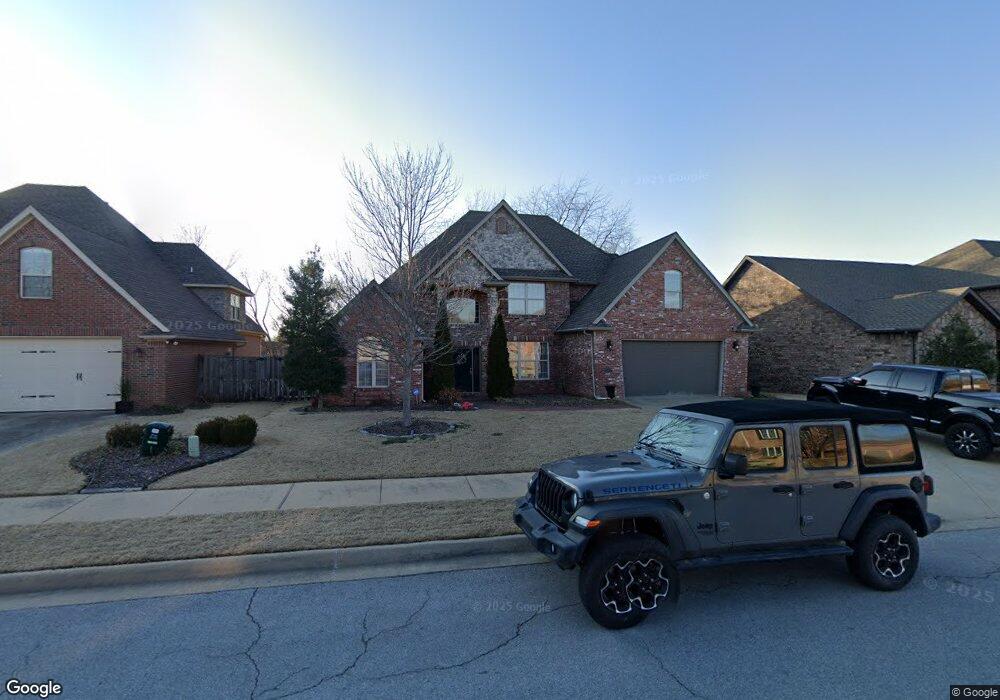
313 NW O St Bentonville, AR 72712
Estimated Value: $664,669 - $863,000
4
Beds
3
Baths
3,017
Sq Ft
$254/Sq Ft
Est. Value
About This Home
This home is located at 313 NW O St, Bentonville, AR 72712 and is currently estimated at $765,167, approximately $253 per square foot. 313 NW O St is a home located in Benton County with nearby schools including Thomas Jefferson Elementary School, Ardis Ann Middle School, and Lincoln Junior High School.
Ownership History
Date
Name
Owned For
Owner Type
Purchase Details
Closed on
May 23, 2007
Sold by
Perrin Construction Llc
Bought by
Estelle Mark A and Brown Estelle Amanda K
Current Estimated Value
Home Financials for this Owner
Home Financials are based on the most recent Mortgage that was taken out on this home.
Original Mortgage
$35,300
Outstanding Balance
$21,355
Interest Rate
6.16%
Estimated Equity
$743,812
Purchase Details
Closed on
Oct 7, 2005
Sold by
Mumford Wayne and Mumford Marliza
Bought by
Perrin Construction Llc
Home Financials for this Owner
Home Financials are based on the most recent Mortgage that was taken out on this home.
Original Mortgage
$320,000
Interest Rate
5.69%
Create a Home Valuation Report for This Property
The Home Valuation Report is an in-depth analysis detailing your home's value as well as a comparison with similar homes in the area
Home Values in the Area
Average Home Value in this Area
Purchase History
| Date | Buyer | Sale Price | Title Company |
|---|---|---|---|
| Estelle Mark A | $353,000 | Waco Title Company | |
| Perrin Construction Llc | $68,000 | Waco Title Company |
Source: Public Records
Mortgage History
| Date | Status | Borrower | Loan Amount |
|---|---|---|---|
| Open | Estelle Mark A | $35,300 | |
| Open | Estelle Mark A | $282,400 | |
| Previous Owner | Perrin Construction Llc | $320,000 |
Source: Public Records
Tax History Compared to Growth
Tax History
| Year | Tax Paid | Tax Assessment Tax Assessment Total Assessment is a certain percentage of the fair market value that is determined by local assessors to be the total taxable value of land and additions on the property. | Land | Improvement |
|---|---|---|---|---|
| 2025 | $4,979 | $114,217 | $24,000 | $90,217 |
| 2024 | $4,775 | $114,217 | $24,000 | $90,217 |
| 2023 | $4,547 | $73,580 | $11,400 | $62,180 |
| 2022 | $4,283 | $73,580 | $11,400 | $62,180 |
| 2021 | $4,267 | $73,580 | $11,400 | $62,180 |
| 2020 | $4,278 | $73,050 | $10,000 | $63,050 |
| 2019 | $4,278 | $73,050 | $10,000 | $63,050 |
| 2018 | $4,303 | $73,050 | $10,000 | $63,050 |
| 2017 | $4,157 | $73,050 | $10,000 | $63,050 |
| 2016 | $4,157 | $73,050 | $10,000 | $63,050 |
| 2015 | $4,410 | $71,360 | $16,000 | $55,360 |
| 2014 | $4,060 | $71,360 | $16,000 | $55,360 |
Source: Public Records
Map
Nearby Homes
- 315 NW O St
- 411 NW Saddlebrook Dr
- 214 El Contento Dr
- 0 NW Olinka Pass St
- 0 SW 2nd St
- 3631 Bitterroot Cove
- 2605 NW 6th St
- 1110 NW 7th St
- 312 NW J St
- 703 NW J St
- 103 NW J St
- 101 Oakhurst St
- 1004 Robin Haven Dr
- 701 NW Ford Ln
- 1002 NW 9th St
- 206 SW Tunbridge Dr
- 1402 NW 11th St
- 912 NW 9th St
- 113 NW Orchard Way
- 2904 SW 2nd St
- 311 NW O St
- 1701 NW Appaloosa St
- 308 NW Saddlebrook Dr
- 309 NW O St
- 306 NW Saddlebrook Dr
- 312 NW O St
- 310 NW O St
- 314 NW O St
- 314 NW "O" St
- 401 NW O St
- 304 NW Saddlebrook Dr
- 400 NW Saddlebrook Dr
- 307 NW O St
- 307 NW "O" St
- 302 NW O St
- 1605 NW Appaloosa Ave
- 302 NW Saddlebrook Dr
- 0 NW Appaloosa Ave Unit 568878
- 0 NW Appaloosa Ave Unit 595565
- 1610 NW 3rd St