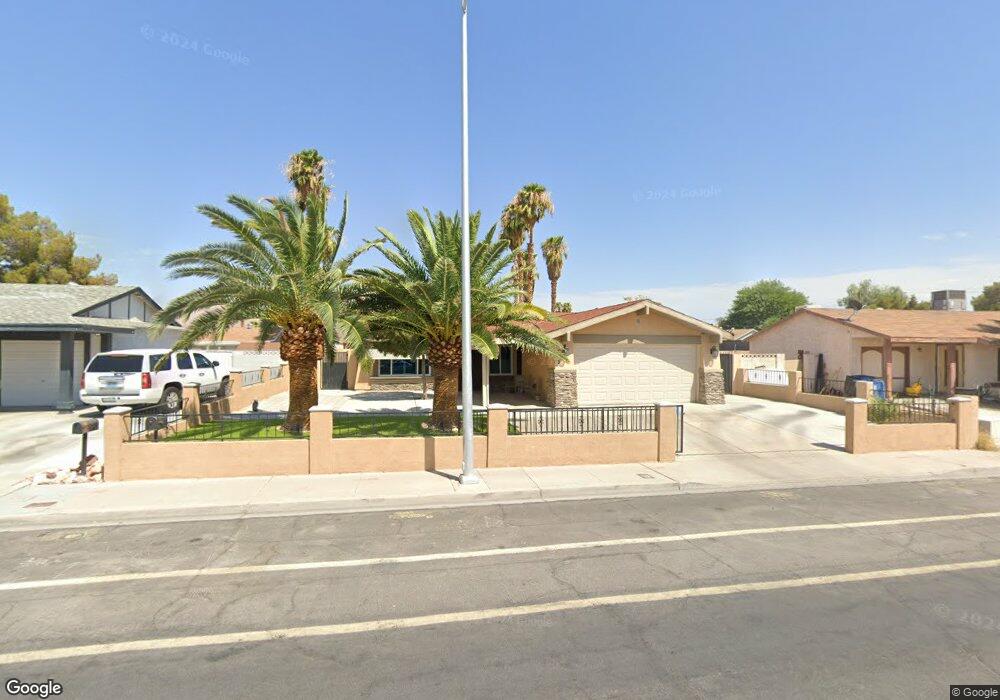
313 Page St Las Vegas, NV 89110
East Las Vegas NeighborhoodEstimated Value: $315,000 - $357,000
3
Beds
2
Baths
1,134
Sq Ft
$296/Sq Ft
Est. Value
About This Home
This home is located at 313 Page St, Las Vegas, NV 89110 and is currently estimated at $335,586, approximately $295 per square foot. 313 Page St is a home located in Clark County with nearby schools including Elbert Edwards Elementary School, Dell H Robison Middle School, and Eldorado High School.
Ownership History
Date
Name
Owned For
Owner Type
Purchase Details
Closed on
Sep 4, 2018
Sold by
Troncoso Cruz E
Bought by
Troncoso Cruz and The Cruz Troncoso Revocable Living Trust
Current Estimated Value
Purchase Details
Closed on
Feb 19, 2003
Sold by
Roach Paul and Roach Pamela L
Bought by
Troncoso Cruz E
Home Financials for this Owner
Home Financials are based on the most recent Mortgage that was taken out on this home.
Original Mortgage
$108,000
Outstanding Balance
$46,186
Interest Rate
5.93%
Estimated Equity
$289,400
Purchase Details
Closed on
Apr 18, 1997
Sold by
Oleary Leo E and Oleary Linda
Bought by
Roach Paul and Roach Pamela L
Home Financials for this Owner
Home Financials are based on the most recent Mortgage that was taken out on this home.
Original Mortgage
$96,237
Interest Rate
7.98%
Mortgage Type
FHA
Create a Home Valuation Report for This Property
The Home Valuation Report is an in-depth analysis detailing your home's value as well as a comparison with similar homes in the area
Home Values in the Area
Average Home Value in this Area
Purchase History
| Date | Buyer | Sale Price | Title Company |
|---|---|---|---|
| Troncoso Cruz | -- | None Available | |
| Troncoso Cruz E | $120,000 | Fidelity National Title | |
| Roach Paul | $97,500 | First American Title Co |
Source: Public Records
Mortgage History
| Date | Status | Borrower | Loan Amount |
|---|---|---|---|
| Open | Troncoso Cruz E | $108,000 | |
| Previous Owner | Roach Paul | $96,237 |
Source: Public Records
Tax History Compared to Growth
Tax History
| Year | Tax Paid | Tax Assessment Tax Assessment Total Assessment is a certain percentage of the fair market value that is determined by local assessors to be the total taxable value of land and additions on the property. | Land | Improvement |
|---|---|---|---|---|
| 2025 | $787 | $46,015 | $24,150 | $21,865 |
| 2024 | $764 | $46,015 | $24,150 | $21,865 |
| 2023 | $764 | $48,410 | $26,600 | $21,810 |
| 2022 | $742 | $43,083 | $22,750 | $20,333 |
| 2021 | $721 | $40,777 | $21,000 | $19,777 |
| 2020 | $697 | $39,248 | $19,250 | $19,998 |
| 2019 | $688 | $35,835 | $15,750 | $20,085 |
| 2018 | $657 | $32,947 | $13,300 | $19,647 |
| 2017 | $1,064 | $32,455 | $12,250 | $20,205 |
| 2016 | $623 | $27,983 | $7,000 | $20,983 |
| 2015 | $621 | $25,587 | $5,600 | $19,987 |
| 2014 | $602 | $18,910 | $4,200 | $14,710 |
Source: Public Records
Map
Nearby Homes
- 4428 Ash Ave
- 4436 E Ogden Ave
- 4632 Shoen Ave
- 408 Rhoda St
- 132 Hillsway Dr
- 4437 Isabella Ave
- 416 Martha St
- 4649 Cuva Ct Unit 4
- 255 N Lamb Blvd Unit D
- 413 N Lamb Blvd Unit F
- 4424 Sunrise Ave
- 409 Marion Dr
- 4533 Diamond Head Dr
- 45 Logan Ct
- 4705 Elm Ave
- 52 Madras Cir
- 425 N Lamb Blvd Unit D
- 211 N Lamb Blvd Unit A
- 211 N Lamb Blvd Unit D
- 213 N Lamb Blvd Unit F