Estimated Value: $309,000 - $365,046
3
Beds
2
Baths
1,900
Sq Ft
$178/Sq Ft
Est. Value
About This Home
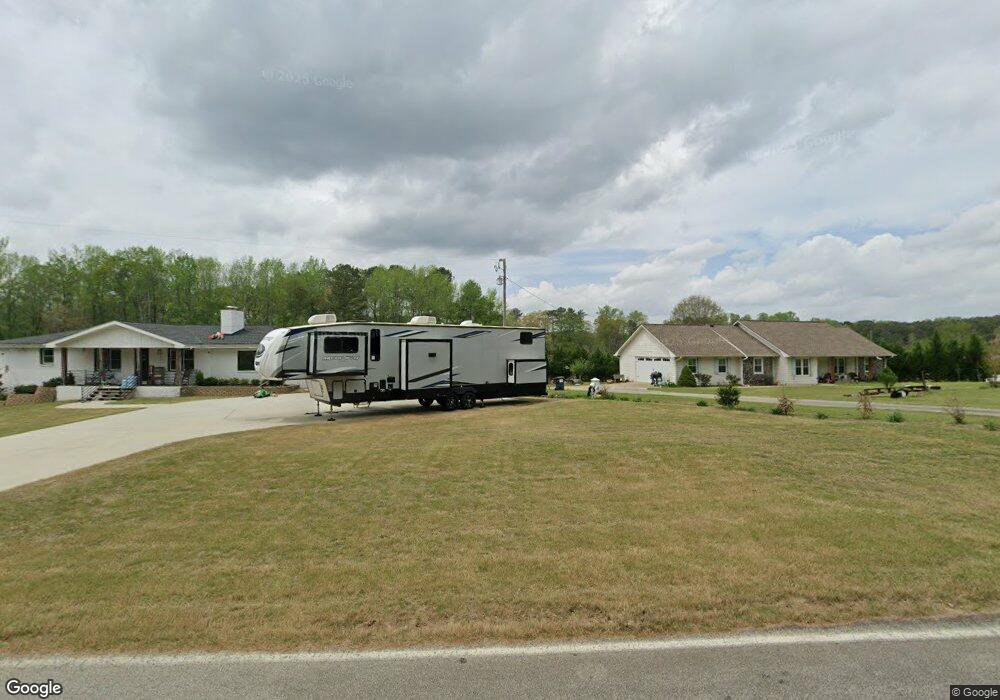
This home is located at 313 Pool Way, Hiram, GA 30141 and is currently estimated at $337,762, approximately $177 per square foot. 313 Pool Way is a home located in Paulding County with nearby schools including Hiram Elementary School, J. A. Dobbins Middle School, and Hiram High School.
Ownership History
Date
Name
Owned For
Owner Type
Purchase Details
Closed on
May 26, 2010
Sold by
Thaxton John R and Thaxton Frances Kristen
Bought by
Thaxton John R
Current Estimated Value
Purchase Details
Closed on
Sep 30, 2006
Sold by
Thaxton John R
Home Financials for this Owner
Home Financials are based on the most recent Mortgage that was taken out on this home.
Original Mortgage
$23,700
Interest Rate
6.06%
Mortgage Type
Stand Alone Second
Purchase Details
Closed on
Sep 29, 2006
Sold by
Thaxton John R
Bought by
Thaxton John R and Thaxton Frances K
Home Financials for this Owner
Home Financials are based on the most recent Mortgage that was taken out on this home.
Original Mortgage
$23,700
Interest Rate
6.06%
Mortgage Type
Stand Alone Second
Purchase Details
Closed on
May 18, 2001
Sold by
Hurst Danny L and Hurst Hope E
Purchase Details
Closed on
May 17, 2001
Sold by
Hurst Hope Elaine
Create a Home Valuation Report for This Property
The Home Valuation Report is an in-depth analysis detailing your home's value as well as a comparison with similar homes in the area
Home Values in the Area
Average Home Value in this Area
Purchase History
| Date | Buyer | Sale Price | Title Company |
|---|---|---|---|
| Thaxton John R | -- | -- | |
| -- | -- | -- | |
| Thaxton John R | -- | -- | |
| Thaxton John R | -- | -- | |
| Thaxton John R | $158,000 | -- | |
| -- | $158,000 | -- | |
| -- | $139,200 | -- | |
| -- | -- | -- |
Source: Public Records
Mortgage History
| Date | Status | Borrower | Loan Amount |
|---|---|---|---|
| Previous Owner | -- | $23,700 | |
| Previous Owner | -- | $126,400 |
Source: Public Records
Tax History
| Year | Tax Paid | Tax Assessment Tax Assessment Total Assessment is a certain percentage of the fair market value that is determined by local assessors to be the total taxable value of land and additions on the property. | Land | Improvement |
|---|---|---|---|---|
| 2025 | $3,014 | $124,784 | $24,440 | $100,344 |
| 2024 | $2,993 | $123,548 | $24,440 | $99,108 |
| 2023 | $2,992 | $117,288 | $23,800 | $93,488 |
| 2022 | $2,648 | $103,432 | $19,360 | $84,072 |
| 2021 | $2,278 | $80,252 | $15,400 | $64,852 |
| 2020 | $2,094 | $72,360 | $14,520 | $57,840 |
| 2019 | $1,934 | $66,056 | $15,400 | $50,656 |
| 2018 | $1,618 | $55,552 | $15,400 | $40,152 |
| 2017 | $1,474 | $50,128 | $14,720 | $35,408 |
| 2016 | $1,322 | $45,597 | $14,480 | $31,117 |
| 2015 | $1,338 | $45,317 | $14,480 | $30,837 |
| 2014 | $1,256 | $41,641 | $19,240 | $22,401 |
| 2013 | -- | $41,640 | $19,240 | $22,400 |
Source: Public Records
Map
Nearby Homes
- 480 Pool Rd
- 0 Morris Rd Unit 7337374
- 0 Morris Rd Unit 10626403
- 37 Forkwood Cir
- 00 Bill Carruth Pkwy
- 0 Bill Carruth Pkwy Unit 10673923
- 55 Cathy Ln
- 00001 Bill Carruth Pkwy
- 38 Harpers Lake Dr
- 236 Forkwood Way
- 5223 Mourning Dove Way SW
- 371 Angham Rd
- 487 Valerie Cir
- 108 Vickie Dr
- 158 Arnold Ln
- 103 S Forty Pass W
- 965 Angham Rd
- 288 Valerie Cir
- 1779 Cleburne Pkwy
- 388 Bennett Rd
Your Personal Tour Guide
Ask me questions while you tour the home.