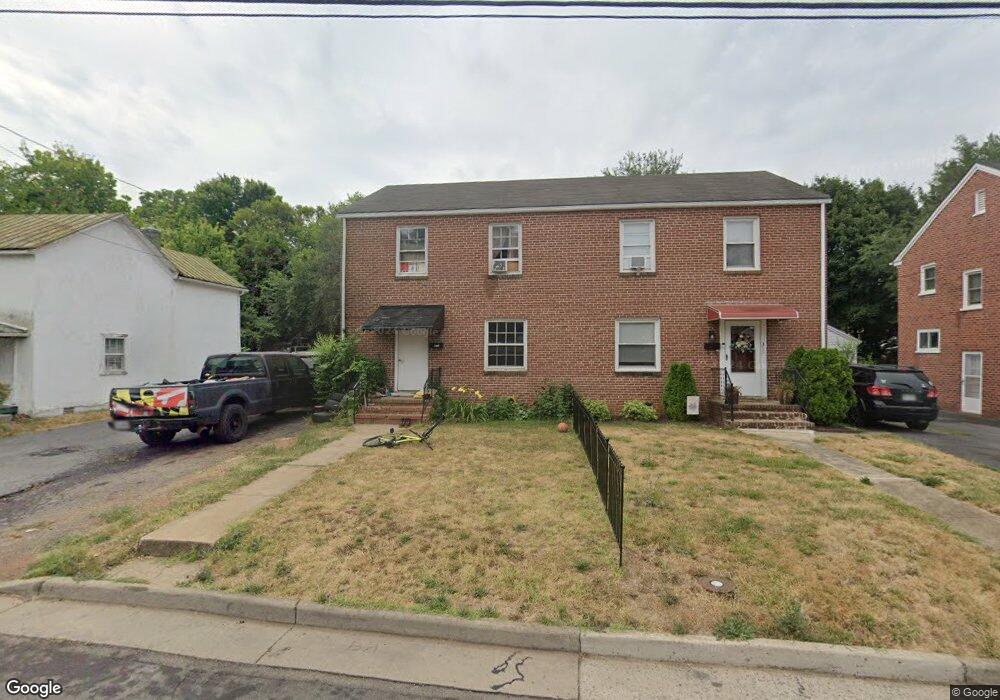
313 Prospect St Front Royal, VA 22630
Estimated Value: $212,000 - $250,000
3
Beds
1
Bath
1,232
Sq Ft
$185/Sq Ft
Est. Value
About This Home
This home is located at 313 Prospect St, Front Royal, VA 22630 and is currently estimated at $228,111, approximately $185 per square foot. 313 Prospect St is a home located in Warren County with nearby schools including Hilda J. Barbour Elementary School, Warren County High School, and Mountain Laurel Montessori School.
Ownership History
Date
Name
Owned For
Owner Type
Purchase Details
Closed on
Jan 28, 2022
Sold by
Bennett Manuel Wendy
Bought by
Hussa Michael I and Hussa Danielle
Current Estimated Value
Home Financials for this Owner
Home Financials are based on the most recent Mortgage that was taken out on this home.
Original Mortgage
$121,600
Outstanding Balance
$112,455
Interest Rate
3.22%
Mortgage Type
New Conventional
Estimated Equity
$115,656
Purchase Details
Closed on
Dec 1, 2010
Sold by
Lewis Dorothy and Lewis Chester
Bought by
Manuel Wendy and Manuel Christopher
Purchase Details
Closed on
Apr 21, 2006
Sold by
Ricks Thomas W
Bought by
Bennett Wendy E
Home Financials for this Owner
Home Financials are based on the most recent Mortgage that was taken out on this home.
Original Mortgage
$128,000
Interest Rate
6.25%
Mortgage Type
Adjustable Rate Mortgage/ARM
Create a Home Valuation Report for This Property
The Home Valuation Report is an in-depth analysis detailing your home's value as well as a comparison with similar homes in the area
Home Values in the Area
Average Home Value in this Area
Purchase History
| Date | Buyer | Sale Price | Title Company |
|---|---|---|---|
| Hussa Michael I | $152,000 | Champion Title | |
| Manuel Wendy | -- | -- | |
| Bennett Wendy E | $160,000 | -- |
Source: Public Records
Mortgage History
| Date | Status | Borrower | Loan Amount |
|---|---|---|---|
| Open | Hussa Michael I | $121,600 | |
| Previous Owner | Bennett Wendy E | $128,000 |
Source: Public Records
Tax History
| Year | Tax Paid | Tax Assessment Tax Assessment Total Assessment is a certain percentage of the fair market value that is determined by local assessors to be the total taxable value of land and additions on the property. | Land | Improvement |
|---|---|---|---|---|
| 2025 | $1,233 | $257,500 | $39,700 | $217,800 |
| 2024 | $841 | $158,700 | $23,000 | $135,700 |
| 2023 | $778 | $158,700 | $23,000 | $135,700 |
| 2022 | $713 | $108,800 | $20,000 | $88,800 |
| 2021 | $141 | $108,800 | $20,000 | $88,800 |
| 2020 | $713 | $108,800 | $20,000 | $88,800 |
| 2019 | $713 | $108,800 | $20,000 | $88,800 |
| 2018 | $649 | $98,400 | $20,000 | $78,400 |
| 2017 | $640 | $98,400 | $20,000 | $78,400 |
| 2016 | $610 | $98,400 | $20,000 | $78,400 |
| 2015 | -- | $98,400 | $20,000 | $78,400 |
| 2014 | -- | $97,600 | $20,000 | $77,600 |
Source: Public Records
Map
Nearby Homes
- 305 Prospect St
- 231 Mosby Ln
- 234 Short St
- 211 Laurel St
- 214 S Royal Ave
- 349 Ritenour St
- 602 and 604 Radham St
- 704 Parkview Dr
- 713 Campbell Cir
- 201 Peach Tree Ct
- 129 Luray Ave
- 714 Parkview Dr
- 107 Highfield Ln
- 124 Pimpernel Place
- 200 Washington Ave
- 220 Manassas Ave
- 16 Gloucester Rd
- 20 Gloucester Rd
- 822 William St
- 107 Richmond Rd
- 311 E Prospect St
- 313 E Prospect St
- 311 Prospect St
- 309 Prospect St
- 401 Prospect St
- 310 Prospect St
- 405 Prospect St
- 301 Prospect St
- 310 Cloud St
- 240 Cloud St
- 236 Cloud St
- 400 Prospect St
- 303 Blue Ridge Ave
- 314 Cloud St
- 311 Blue Ridge Ave
- 234 Cloud St
- 241 Blue Ridge Ave
- 233 Prospect St Unit A
- 233 Prospect St Unit B
- 233 Prospect St
Your Personal Tour Guide
Ask me questions while you tour the home.