Estimated Value: $275,000 - $343,000
2
Beds
1
Bath
884
Sq Ft
$333/Sq Ft
Est. Value
About This Home
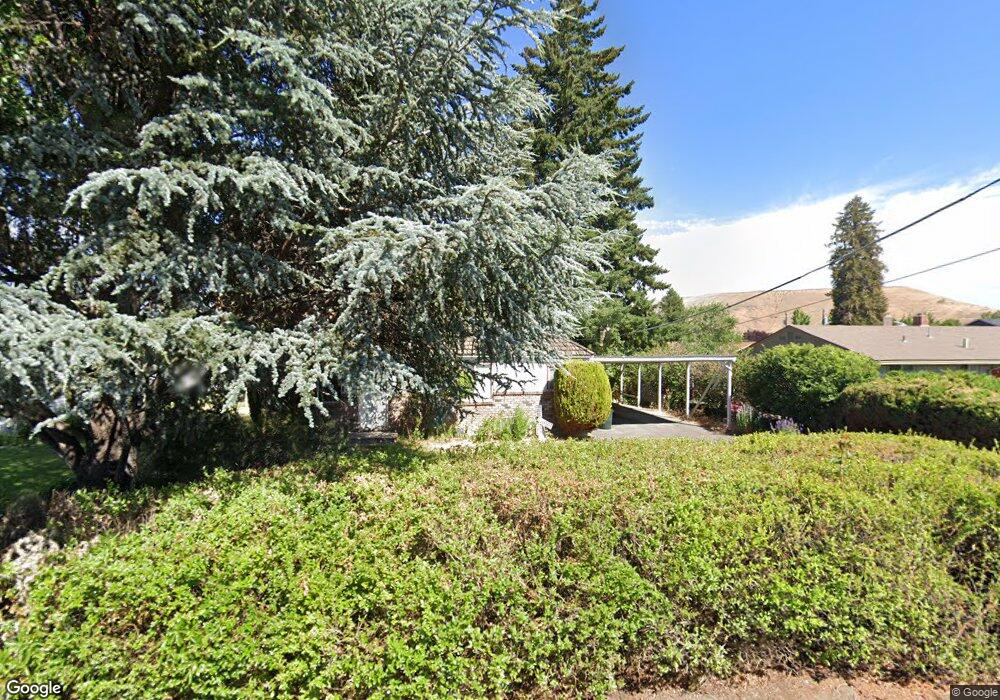
This home is located at 313 S 3rd St, Selah, WA 98942 and is currently estimated at $294,221, approximately $332 per square foot. 313 S 3rd St is a home located in Yakima County with nearby schools including John Campbell Primary School, Selah Intermediate School, and Selah Middle School.
Ownership History
Date
Name
Owned For
Owner Type
Purchase Details
Closed on
Oct 27, 2006
Sold by
Rockwell Ryan G
Bought by
Rockwell Megan M
Current Estimated Value
Home Financials for this Owner
Home Financials are based on the most recent Mortgage that was taken out on this home.
Original Mortgage
$94,800
Outstanding Balance
$56,641
Interest Rate
6.39%
Mortgage Type
New Conventional
Estimated Equity
$237,580
Purchase Details
Closed on
Oct 26, 2006
Sold by
Kennedy Wade R and Kennedy Winter D
Bought by
Rockwell Megan M
Home Financials for this Owner
Home Financials are based on the most recent Mortgage that was taken out on this home.
Original Mortgage
$94,800
Outstanding Balance
$56,641
Interest Rate
6.39%
Mortgage Type
New Conventional
Estimated Equity
$237,580
Purchase Details
Closed on
Sep 25, 2006
Sold by
Ball David Lee
Bought by
Kennedy Wade R and Kennedy Winter D
Home Financials for this Owner
Home Financials are based on the most recent Mortgage that was taken out on this home.
Original Mortgage
$94,800
Outstanding Balance
$56,641
Interest Rate
6.39%
Mortgage Type
New Conventional
Estimated Equity
$237,580
Create a Home Valuation Report for This Property
The Home Valuation Report is an in-depth analysis detailing your home's value as well as a comparison with similar homes in the area
Home Values in the Area
Average Home Value in this Area
Purchase History
| Date | Buyer | Sale Price | Title Company |
|---|---|---|---|
| Rockwell Megan M | -- | First American Title Comp | |
| Rockwell Megan M | $118,500 | First American Title Comp | |
| Kennedy Wade R | $80,000 | First American Title Comp |
Source: Public Records
Mortgage History
| Date | Status | Borrower | Loan Amount |
|---|---|---|---|
| Open | Rockwell Megan M | $94,800 | |
| Closed | Kennedy Wade R | $72,000 |
Source: Public Records
Tax History Compared to Growth
Tax History
| Year | Tax Paid | Tax Assessment Tax Assessment Total Assessment is a certain percentage of the fair market value that is determined by local assessors to be the total taxable value of land and additions on the property. | Land | Improvement |
|---|---|---|---|---|
| 2025 | $2,230 | $252,200 | $60,100 | $192,100 |
| 2023 | $2,137 | $180,400 | $62,600 | $117,800 |
| 2022 | $1,869 | $173,200 | $52,200 | $121,000 |
| 2021 | $1,588 | $137,700 | $54,300 | $83,400 |
| 2019 | $1,346 | $117,500 | $44,100 | $73,400 |
| 2018 | $1,224 | $94,400 | $44,100 | $50,300 |
| 2017 | $1,139 | $92,000 | $44,100 | $47,900 |
| 2016 | $1,210 | $90,350 | $43,950 | $46,400 |
| 2015 | $1,210 | $97,050 | $43,950 | $53,100 |
| 2014 | $1,210 | $99,850 | $43,750 | $56,100 |
| 2013 | $1,210 | $99,850 | $43,750 | $56,100 |
Source: Public Records
Map
Nearby Homes
- 310 Riverview Ave Unit C
- 105 Hillcrest Dr
- 402 Pleasant Ave
- 1769 Naches Wenas Rd Unit 117
- 807 Ridgeview Ave
- 701 S 5th St
- 110 S 10th St
- 704 W Fremont Ave
- 710 W Bartlett Ave
- 205 N 7th St
- 708 W Bartlett Ave
- 1106 Heritage Hills Ln
- 12 S 12th Street Loop M0to6oicl3z
- 308 N Wenas Rd
- 6 S 12th St
- 408 N 10th St
- 1504 W Naches Ave
- 765 Dixie Dr
- 1609 W Yakima Ave
- 1700 W 1st Ave
- 315 S 3rd St
- 309 1/2 S 3rd St
- 203 Valleyview Ave
- 207 Valleyview Ave
- 209 Valleyview Ave
- 311 S 3rd St
- 310 S 3rd St
- 312 S 3rd St
- 307 S 3rd St
- 314 S 3rd St
- 307 1/2 S 3rd St
- NNA Crusher Canyon Rd
- 305 S 3rd St
- 316 S 3rd St
- 306 S 3rd St
- 201A Valleyview Ave
- 307 S 4th St
- 201 Valleyview Ave Unit A
- 201 Valleyview Ave Unit B
- 201B Valleyview Ave Unit 2096652-3926080