


313 S 3rd St Tonkawa, OK 74653
Estimated payment $588/month
Highlights
- Bungalow
- 1-Story Property
- Central Heating and Cooling System
About This Home
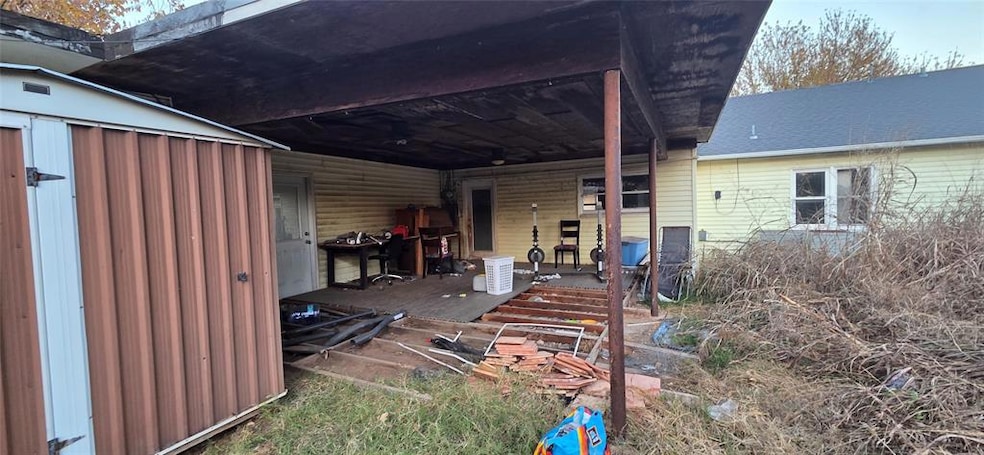
Spacious 4-bedroom, 2-bathroom home. This Tonkawa residence features beautiful wood floors throughout and a large attached carport. Enjoy peace of mind with a new sewer line installation and a composition roof installed in 2016 that has been carefully maintained. The kitchen boasts what the owner believes are granite countertops, and one bathroom has been fully remodeled with a new tub and vanity. This home is a fantastic canvas, ready for your finishing touches and personalized style. Appliances (washer, dryer, fridge, and stove) are not included, offering the buyer a chance to select their own. Opportunity for climate control system personalization.
Home Details
Home Type
- Single Family
Year Built
- Built in 1948
Parking
- Carport
Home Design
- Bungalow
- Slab Foundation
- Frame Construction
Interior Spaces
- 1,756 Sq Ft Home
- 1-Story Property
Bedrooms and Bathrooms
- 4 Bedrooms
- 2 Full Bathrooms
Schools
- Tonkawa Elementary School
- Tonkawa Middle School
- Tonkawa High School
Additional Features
- 9,448 Sq Ft Lot
- Central Heating and Cooling System
Listing and Financial Details
- Legal Lot and Block 001 / 001
Map
Home Values in the Area
Average Home Value in this Area
Tax History
| Year | Tax Paid | Tax Assessment Tax Assessment Total Assessment is a certain percentage of the fair market value that is determined by local assessors to be the total taxable value of land and additions on the property. | Land | Improvement |
|---|---|---|---|---|
| 2025 | $975 | $9,602 | $1,085 | $8,517 |
| 2024 | $981 | $10,015 | $1,085 | $8,930 |
| 2023 | $981 | $10,231 | $1,085 | $9,146 |
| 2022 | $1,009 | $10,435 | $1,085 | $9,350 |
| 2021 | $1,015 | $10,435 | $1,085 | $9,350 |
| 2020 | $1,001 | $10,435 | $1,085 | $9,350 |
| 2019 | $919 | $10,030 | $1,085 | $8,945 |
| 2018 | $918 | $10,174 | $1,085 | $9,089 |
| 2017 | $1,020 | $10,780 | $1,085 | $9,695 |
| 2016 | $680 | $8,406 | $904 | $7,502 |
| 2015 | $695 | $8,576 | $904 | $7,672 |
| 2014 | $741 | $8,582 | $904 | $7,678 |
Property History
| Date | Event | Price | List to Sale | Price per Sq Ft |
|---|---|---|---|---|
| 02/15/2026 02/15/26 | Price Changed | $94,900 | -5.0% | $54 / Sq Ft |
| 12/12/2025 12/12/25 | Price Changed | $99,900 | -4.8% | $57 / Sq Ft |
| 12/04/2025 12/04/25 | Price Changed | $104,900 | -8.7% | $60 / Sq Ft |
| 12/01/2025 12/01/25 | Price Changed | $114,900 | -8.0% | $65 / Sq Ft |
| 11/19/2025 11/19/25 | For Sale | $124,900 | -- | $71 / Sq Ft |
Purchase History
| Date | Type | Sale Price | Title Company |
|---|---|---|---|
| Warranty Deed | $98,000 | Security Title Services | |
| Quit Claim Deed | -- | -- | |
| Warranty Deed | $38,000 | -- |
Mortgage History
| Date | Status | Loan Amount | Loan Type |
|---|---|---|---|
| Open | $96,224 | FHA | |
| Previous Owner | $56,000 | New Conventional |
Source: MLSOK
MLS Number: 1202135
APN: 3100-00-001-001-0-000-00
Disclaimer: Certain information contained herein is derived from information provided by parties other than Homes.com. All information provided is deemed reliable, but is not guaranteed to be accurate and should be independently verified.
![]() Based on information submitted to the MLS GRID. All data is obtained from various sources and may not have been verified by broker or MLS GRID. Supplied Open House Information is subject to change without notice. All information should be independently reviewed and verified for accuracy. Properties may or may not be listed by the office/agent presenting the information. Some IDX listings have been excluded from this website. IDX information is provided exclusively for personal, non-commercial use, and may not be used for any purpose other than to identify prospective properties consumers may be interested in purchasing.
Based on information submitted to the MLS GRID. All data is obtained from various sources and may not have been verified by broker or MLS GRID. Supplied Open House Information is subject to change without notice. All information should be independently reviewed and verified for accuracy. Properties may or may not be listed by the office/agent presenting the information. Some IDX listings have been excluded from this website. IDX information is provided exclusively for personal, non-commercial use, and may not be used for any purpose other than to identify prospective properties consumers may be interested in purchasing.
Information is deemed reliable but not guaranteed.
This information is not verified for authenticity or accuracy, is not guaranteed and may not reflect all real estate activity in the market.
Copyright 2026 MLSOK, Inc. All rights reserved.
Based on information submitted to the MLS GRID
- 306 S 2nd St
- 200 S 1st St Unit 3420
- 207 S Barnes St
- 502 & 504 S Main St
- 1008 E Oklahoma Ave
- 208 N 4th St Unit 3000
- 206 W Grand Ave
- 304 N 7th St
- 405 N 6th St Unit 3760
- 316 N Jenkins St
- 405 N 7th St
- 117 Wheatheart Dr
- 112 Wheatheart Dr
- 124 Mill Rd
- 201 Jester Rd
- 5 Acres Fountain Road-Track
- S 44th
- 12501 S 44th St
- 00000 W Oakland Rd
- 0000 S 92nd St

Ask me questions while you tour the home.