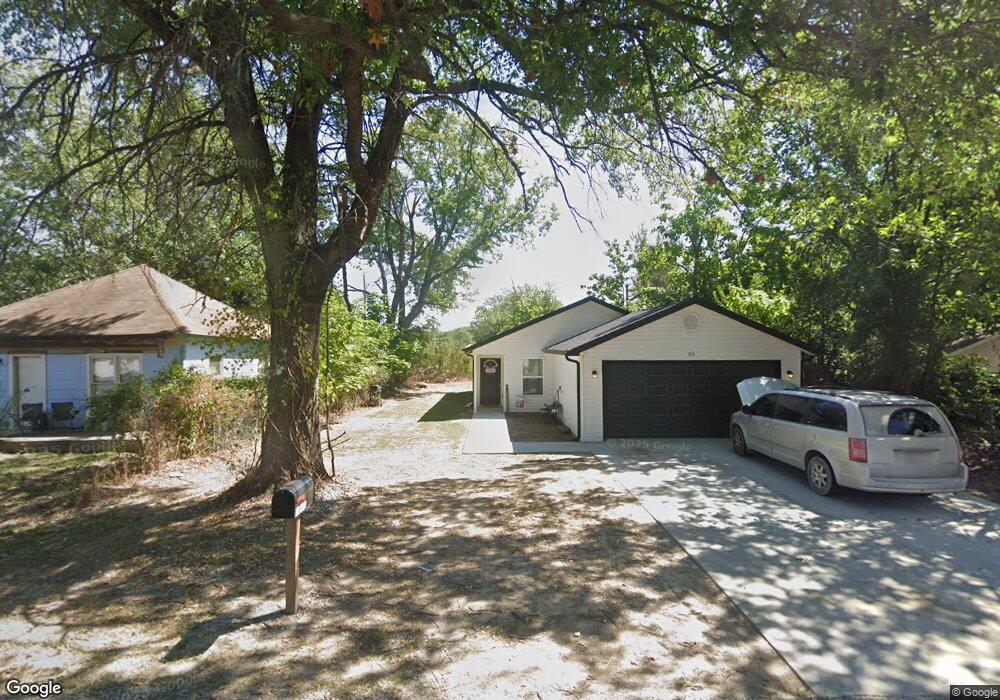
313 S Cedar St Commerce, OK 74339
Estimated Value: $85,000 - $156,000
2
Beds
1
Bath
1,045
Sq Ft
$125/Sq Ft
Est. Value
About This Home
This home is located at 313 S Cedar St, Commerce, OK 74339 and is currently estimated at $130,910, approximately $125 per square foot. 313 S Cedar St is a home located in Ottawa County with nearby schools including Alexander Elementary School, Commerce Middle School, and Commerce High School.
Ownership History
Date
Name
Owned For
Owner Type
Purchase Details
Closed on
Apr 12, 2024
Sold by
Sampson William K and Sampson Staci R
Bought by
Alpha Real Property Llc
Current Estimated Value
Home Financials for this Owner
Home Financials are based on the most recent Mortgage that was taken out on this home.
Original Mortgage
$144,000
Outstanding Balance
$128,160
Interest Rate
6.87%
Mortgage Type
Credit Line Revolving
Estimated Equity
$2,750
Purchase Details
Closed on
Apr 13, 2022
Sold by
Dever Investments Llc
Bought by
Sampson William K and Sampson Staci R
Purchase Details
Closed on
Mar 3, 2022
Sold by
Isabel Gonzalez and Isabel Maria
Bought by
Dever Investments Llc
Purchase Details
Closed on
Oct 19, 2021
Sold by
Ottawa County
Bought by
Gonzalez Martin and Gonzalez Maria Isabel
Purchase Details
Closed on
Jun 10, 2019
Sold by
State Of Oklahoma
Bought by
Masterson Chad and Board Of County Commissioners
Create a Home Valuation Report for This Property
The Home Valuation Report is an in-depth analysis detailing your home's value as well as a comparison with similar homes in the area
Purchase History
| Date | Buyer | Sale Price | Title Company |
|---|---|---|---|
| Alpha Real Property Llc | $144,000 | None Listed On Document | |
| Sampson William K | -- | Ottawa County Abstract & Title | |
| Dever Investments Llc | $3,000 | None Listed On Document | |
| Gonzalez Martin | $200 | None Available | |
| Masterson Chad | $1,122 | None Available |
Source: Public Records
Mortgage History
| Date | Status | Borrower | Loan Amount |
|---|---|---|---|
| Open | Alpha Real Property Llc | $144,000 |
Source: Public Records
Tax History
| Year | Tax Paid | Tax Assessment Tax Assessment Total Assessment is a certain percentage of the fair market value that is determined by local assessors to be the total taxable value of land and additions on the property. | Land | Improvement |
|---|---|---|---|---|
| 2025 | $1,454 | $14,989 | $171 | $14,818 |
| 2024 | $265 | $2,726 | $171 | $2,555 |
| 2023 | $265 | $2,726 | $171 | $2,555 |
| 2022 | $249 | $2,726 | $171 | $2,555 |
| 2021 | $0 | $0 | $0 | $0 |
| 2020 | $0 | $0 | $0 | $0 |
| 2019 | $139 | $1,451 | $171 | $1,280 |
| 2018 | $140 | $1,451 | $171 | $1,280 |
| 2017 | $139 | $1,451 | $171 | $1,280 |
| 2016 | $165 | $1,698 | $171 | $1,527 |
| 2015 | $95 | $1,397 | $154 | $1,243 |
| 2014 | $115 | $1,617 | $163 | $1,454 |
Source: Public Records
Map
Nearby Homes
Your Personal Tour Guide
Ask me questions while you tour the home.