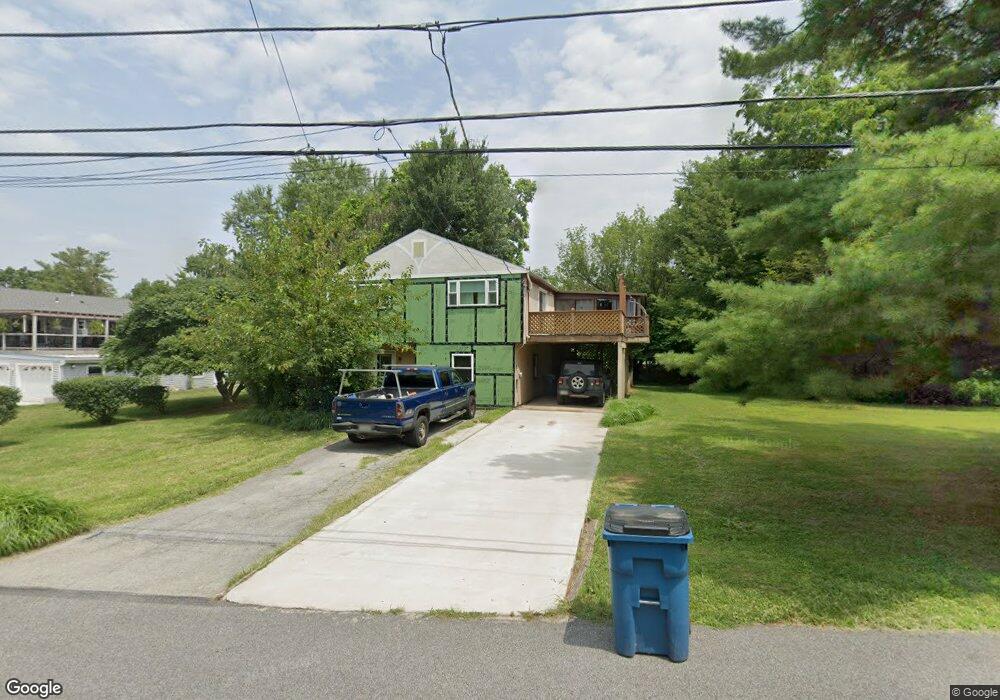
313 S Concord Rd West Chester, PA 19382
Estimated Value: $349,000 - $574,000
3
Beds
2
Baths
1,512
Sq Ft
$331/Sq Ft
Est. Value
About This Home
This home is located at 313 S Concord Rd, West Chester, PA 19382 and is currently estimated at $499,829, approximately $330 per square foot. 313 S Concord Rd is a home located in Chester County with nearby schools including Fern Hill Elementary School, J.R. Fugett Middle School, and West Chester East High School.
Ownership History
Date
Name
Owned For
Owner Type
Purchase Details
Closed on
Jan 6, 2011
Sold by
Bank Of America National Association
Bought by
Rampulla Renee N
Current Estimated Value
Home Financials for this Owner
Home Financials are based on the most recent Mortgage that was taken out on this home.
Original Mortgage
$182,415
Interest Rate
5.5%
Mortgage Type
FHA
Purchase Details
Closed on
Jul 7, 2010
Sold by
Pierce Richard and Lasalle Bank Na
Bought by
Bank Of America National Association
Purchase Details
Closed on
Aug 10, 2000
Sold by
Harper Pamela D
Bought by
Schneider Paul J and Bannon Megan
Home Financials for this Owner
Home Financials are based on the most recent Mortgage that was taken out on this home.
Original Mortgage
$134,931
Interest Rate
8.21%
Mortgage Type
FHA
Create a Home Valuation Report for This Property
The Home Valuation Report is an in-depth analysis detailing your home's value as well as a comparison with similar homes in the area
Home Values in the Area
Average Home Value in this Area
Purchase History
| Date | Buyer | Sale Price | Title Company |
|---|---|---|---|
| Rampulla Renee N | $165,000 | None Available | |
| Bank Of America National Association | -- | None Available | |
| Schneider Paul J | $135,000 | -- |
Source: Public Records
Mortgage History
| Date | Status | Borrower | Loan Amount |
|---|---|---|---|
| Previous Owner | Rampulla Renee N | $182,415 | |
| Previous Owner | Schneider Paul J | $134,931 |
Source: Public Records
Tax History Compared to Growth
Tax History
| Year | Tax Paid | Tax Assessment Tax Assessment Total Assessment is a certain percentage of the fair market value that is determined by local assessors to be the total taxable value of land and additions on the property. | Land | Improvement |
|---|---|---|---|---|
| 2025 | $4,280 | $147,650 | $51,390 | $96,260 |
| 2024 | $4,280 | $147,650 | $51,390 | $96,260 |
| 2023 | $4,280 | $147,650 | $51,390 | $96,260 |
| 2022 | $4,224 | $147,650 | $51,390 | $96,260 |
| 2021 | $4,166 | $147,650 | $51,390 | $96,260 |
| 2020 | $4,139 | $147,650 | $51,390 | $96,260 |
| 2019 | $4,081 | $147,650 | $51,390 | $96,260 |
| 2018 | $3,994 | $147,650 | $51,390 | $96,260 |
| 2017 | $3,908 | $147,650 | $51,390 | $96,260 |
| 2016 | $3,296 | $147,650 | $51,390 | $96,260 |
| 2015 | $3,296 | $147,650 | $51,390 | $96,260 |
| 2014 | $3,296 | $147,650 | $51,390 | $96,260 |
Source: Public Records
Map
Nearby Homes
- 852 Cedar Ave
- 809 Amelia Dr
- 130 Chatwood Ave
- 220 Spring Ln
- 210 Spring Ln
- 12 Sherman Alley
- 335 S Adams St
- 538 S Adams St
- 404 Warren Rd
- 317 S Adams St
- 412 Danielle Way
- 342 E Barnard St
- 138 Justin Dr
- 110 S Adams St
- 635 S Matlack St
- 305 S Matlack St
- 432 Hightop Rd
- 615 S Walnut St
- 615-617 S Walnut St
- 878 Empress Rd
- 309 S Concord Rd
- 318 S Concord Rd
- 316 S Concord Rd
- 307 S Concord Rd
- 314 S Concord Rd
- 320 S Concord Rd
- 312 S Concord Rd
- 303 S Concord Rd
- 898 Justin Ln
- 322 S Concord Rd
- 301 S Concord Rd
- 896 Justin Ln
- 891 Fairmont Dr
- 324 S Concord Rd
- 894 Justin Ln
- 889 Fairmont Dr
- 892 Justin Ln
- 321 Courtney Cir
- 327 Courtney Cir
- 331 Courtney Cir