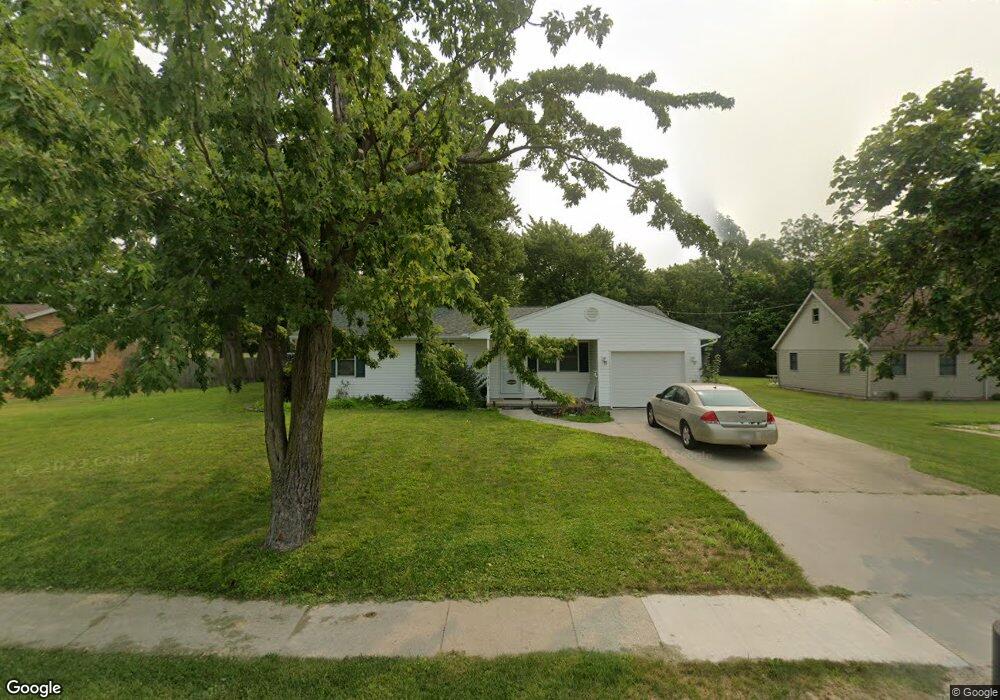
313 S Main St Walbridge, OH 43465
Estimated Value: $145,000 - $232,046
5
Beds
2
Baths
1,636
Sq Ft
$112/Sq Ft
Est. Value
About This Home
This home is located at 313 S Main St, Walbridge, OH 43465 and is currently estimated at $184,012, approximately $112 per square foot. 313 S Main St is a home located in Wood County with nearby schools including Lake Elementary School, Lake Middle School, and Lake High School.
Ownership History
Date
Name
Owned For
Owner Type
Purchase Details
Closed on
Dec 6, 2021
Sold by
Veselka Joseph S and Mary L Veselka Trust
Bought by
Veselka Sarah C
Current Estimated Value
Purchase Details
Closed on
Oct 13, 2021
Sold by
Mary L Veselka Trust and Veselka Joseph S
Bought by
Veselka Sarah C
Purchase Details
Closed on
Aug 13, 2018
Sold by
Veselka Joseph S and Veselka Mary L
Bought by
Veselka Joseph S
Purchase Details
Closed on
May 26, 2010
Sold by
Fouty Millie L
Bought by
Mainstreet Ministries
Purchase Details
Closed on
Jul 5, 1994
Sold by
Eva I Hickman Est
Bought by
Stutts Jerry D Stutts and Stutts Wendy S
Home Financials for this Owner
Home Financials are based on the most recent Mortgage that was taken out on this home.
Original Mortgage
$30,600
Interest Rate
8.66%
Mortgage Type
VA
Purchase Details
Closed on
Dec 6, 1976
Bought by
Hickman Eva I
Create a Home Valuation Report for This Property
The Home Valuation Report is an in-depth analysis detailing your home's value as well as a comparison with similar homes in the area
Home Values in the Area
Average Home Value in this Area
Purchase History
| Date | Buyer | Sale Price | Title Company |
|---|---|---|---|
| Veselka Sarah C | -- | None Available | |
| Veselka Sarah C | -- | None Listed On Document | |
| Veselka Joseph S | -- | None Available | |
| Mainstreet Ministries | $9,000 | Attorney | |
| Stutts Jerry D Stutts | $30,000 | -- | |
| Hickman Eva I | -- | -- |
Source: Public Records
Mortgage History
| Date | Status | Borrower | Loan Amount |
|---|---|---|---|
| Previous Owner | Stutts Jerry D Stutts | $30,600 |
Source: Public Records
Tax History
| Year | Tax Paid | Tax Assessment Tax Assessment Total Assessment is a certain percentage of the fair market value that is determined by local assessors to be the total taxable value of land and additions on the property. | Land | Improvement |
|---|---|---|---|---|
| 2025 | $2,180 | $49,035 | $10,885 | $38,150 |
| 2024 | $2,171 | $49,035 | $10,885 | $38,150 |
| 2023 | $2,171 | $49,040 | $10,890 | $38,150 |
| 2021 | $1,959 | $36,790 | $8,090 | $28,700 |
| 2020 | $1,883 | $36,790 | $8,090 | $28,700 |
| 2019 | $1,719 | $30,950 | $8,090 | $22,860 |
| 2018 | $1,208 | $30,950 | $8,090 | $22,860 |
| 2017 | $1,195 | $30,950 | $8,090 | $22,860 |
| 2016 | $1,373 | $34,720 | $7,770 | $26,950 |
| 2015 | $1,373 | $34,720 | $7,770 | $26,950 |
| 2014 | $1,451 | $34,720 | $7,770 | $26,950 |
| 2013 | $1,513 | $34,720 | $7,770 | $26,950 |
Source: Public Records
Map
Nearby Homes
- 100 W Union St
- 225 E Union St
- 30643 Drouillard Rd
- 238 S Bridge Rd
- 236 S Bridge Rd
- 224 S Bridge Rd
- 232 S Bridge Rd
- 241 S Bridge Rd
- 237 S Bridge Rd
- 148 Meadowgate
- 1107 Lemoyne Rd
- 3901 Plumey Rd
- 199 E Bridge Rd
- 0 Williston Rd
- 29751 Brookview Ct
- 3517 Goodrich Ave
- 115 W Bridge Rd
- 113 W Bridge Rd
- 111 W Bridge Rd
- 117 W Bridge Rd
Your Personal Tour Guide
Ask me questions while you tour the home.