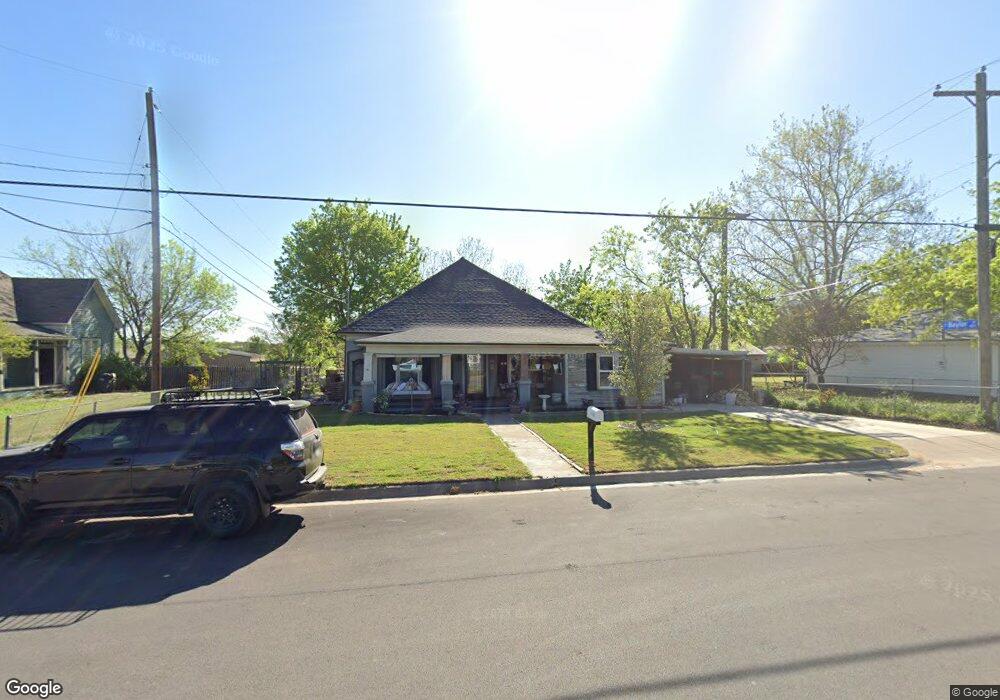
313 S Rusk St Weatherford, TX 76086
Estimated Value: $300,182 - $380,000
3
Beds
2
Baths
1,865
Sq Ft
$179/Sq Ft
Est. Value
About This Home
This home is located at 313 S Rusk St, Weatherford, TX 76086 and is currently estimated at $334,296, approximately $179 per square foot. 313 S Rusk St is a home located in Parker County with nearby schools including Ikard Elementary School, Hall Middle School, and Weatherford High School.
Ownership History
Date
Name
Owned For
Owner Type
Purchase Details
Closed on
Feb 22, 2019
Sold by
Bluemountatn Texas Llc
Bought by
Clay Audrey
Current Estimated Value
Home Financials for this Owner
Home Financials are based on the most recent Mortgage that was taken out on this home.
Original Mortgage
$196,278
Outstanding Balance
$172,564
Interest Rate
4.5%
Mortgage Type
FHA
Estimated Equity
$161,732
Purchase Details
Closed on
Jan 16, 2018
Sold by
Webster Barbara Mae and Wise Barbara Mae
Bought by
Bluemountain Texas Llc
Home Financials for this Owner
Home Financials are based on the most recent Mortgage that was taken out on this home.
Original Mortgage
$150,768
Interest Rate
3.94%
Mortgage Type
Construction
Purchase Details
Closed on
Apr 28, 2009
Sold by
Webster James H & Barbara Dba
Bought by
Wise Barbara Mae
Purchase Details
Closed on
Dec 7, 1998
Bought by
Wise Barbara Mae
Purchase Details
Closed on
May 12, 1983
Bought by
Wise Barbara Mae
Create a Home Valuation Report for This Property
The Home Valuation Report is an in-depth analysis detailing your home's value as well as a comparison with similar homes in the area
Home Values in the Area
Average Home Value in this Area
Purchase History
| Date | Buyer | Sale Price | Title Company |
|---|---|---|---|
| Clay Audrey | -- | Fidelity National Title | |
| Bluemountain Texas Llc | -- | Fidelity National | |
| Wise Barbara Mae | -- | -- | |
| Wise Barbara Mae | -- | -- | |
| Wise Barbara Mae | -- | -- |
Source: Public Records
Mortgage History
| Date | Status | Borrower | Loan Amount |
|---|---|---|---|
| Open | Clay Audrey | $196,278 | |
| Previous Owner | Bluemountain Texas Llc | $150,768 |
Source: Public Records
Tax History Compared to Growth
Tax History
| Year | Tax Paid | Tax Assessment Tax Assessment Total Assessment is a certain percentage of the fair market value that is determined by local assessors to be the total taxable value of land and additions on the property. | Land | Improvement |
|---|---|---|---|---|
| 2025 | $5,926 | $346,860 | $50,000 | $296,860 |
| 2024 | $5,926 | $307,460 | $50,000 | $257,460 |
| 2023 | $5,926 | $307,460 | $50,000 | $257,460 |
| 2022 | $4,229 | $190,640 | $23,000 | $167,640 |
| 2021 | $4,578 | $190,640 | $23,000 | $167,640 |
| 2020 | $4,606 | $190,640 | $23,000 | $167,640 |
| 2019 | $4,868 | $190,640 | $23,000 | $167,640 |
| 2018 | $1,632 | $63,610 | $23,000 | $40,610 |
| 2017 | $1,674 | $63,610 | $23,000 | $40,610 |
| 2016 | $1,674 | $63,610 | $23,000 | $40,610 |
| 2015 | $1,639 | $63,610 | $23,000 | $40,610 |
| 2014 | $1,530 | $60,910 | $23,000 | $37,910 |
Source: Public Records
Map
Nearby Homes
- 315 S Rusk St
- 309 S Rusk St
- 406 E Baylor St
- 319 S Rusk St
- 408 E Baylor St Unit 1
- 411 E Baylor St
- 318 S Rusk St
- 410 E Baylor St
- 308 S Rusk St Unit 10
- 312 S Rusk St
- 306 S Rusk St
- 305 S Rusk St
- 405 E Lee Ave
- 412 E Baylor St
- 323 S Rusk St
- 321 E Lee Ave
- 317 E Lee Ave
- 302 S Rusk St
- 411 E Lee Ave
- 250 Santa fe Dr