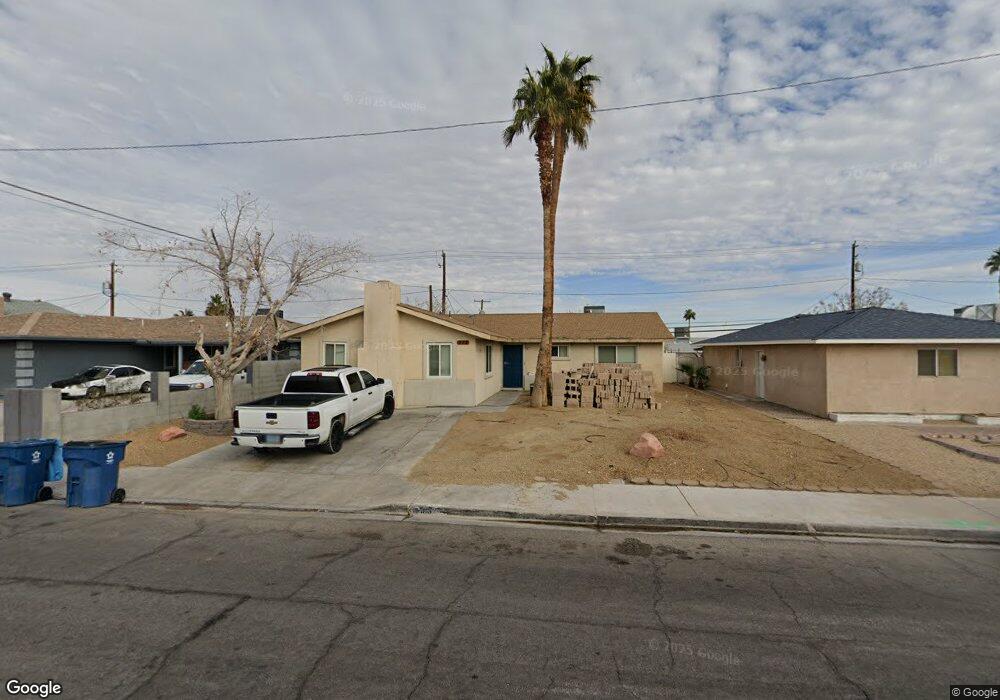
313 S Wallace Dr Las Vegas, NV 89107
Charleston Preservation NeighborhoodEstimated Value: $167,000 - $369,462
3
Beds
2
Baths
1,663
Sq Ft
$176/Sq Ft
Est. Value
About This Home
This home is located at 313 S Wallace Dr, Las Vegas, NV 89107 and is currently estimated at $292,154, approximately $175 per square foot. 313 S Wallace Dr is a home located in Clark County with nearby schools including O. K. Adcock Elementary School, Frank F Garside Junior High School, and Bonanza High School.
Ownership History
Date
Name
Owned For
Owner Type
Purchase Details
Closed on
Dec 5, 2024
Sold by
Canela Jennifer
Bought by
Dejesus Antonio Marin
Current Estimated Value
Home Financials for this Owner
Home Financials are based on the most recent Mortgage that was taken out on this home.
Original Mortgage
$170,000
Outstanding Balance
$168,597
Interest Rate
6.54%
Mortgage Type
Seller Take Back
Estimated Equity
$123,557
Purchase Details
Closed on
Mar 10, 2016
Sold by
Kresyman Joe and Kresyman Shelley
Bought by
Canela Jennifer
Home Financials for this Owner
Home Financials are based on the most recent Mortgage that was taken out on this home.
Original Mortgage
$124,500
Interest Rate
3.72%
Mortgage Type
Seller Take Back
Create a Home Valuation Report for This Property
The Home Valuation Report is an in-depth analysis detailing your home's value as well as a comparison with similar homes in the area
Home Values in the Area
Average Home Value in this Area
Purchase History
| Date | Buyer | Sale Price | Title Company |
|---|---|---|---|
| Dejesus Antonio Marin | $161,720 | Platinum Title And Escrow | |
| Dejesus Antonio Marin | $161,720 | Platinum Title And Escrow | |
| Canela Jennifer | $150,000 | North American Title Main |
Source: Public Records
Mortgage History
| Date | Status | Borrower | Loan Amount |
|---|---|---|---|
| Open | Dejesus Antonio Marin | $170,000 | |
| Closed | Dejesus Antonio Marin | $170,000 | |
| Previous Owner | Canela Jennifer | $124,500 |
Source: Public Records
Tax History Compared to Growth
Tax History
| Year | Tax Paid | Tax Assessment Tax Assessment Total Assessment is a certain percentage of the fair market value that is determined by local assessors to be the total taxable value of land and additions on the property. | Land | Improvement |
|---|---|---|---|---|
| 2025 | $1,165 | $56,602 | $32,200 | $24,402 |
| 2024 | $1,079 | $56,602 | $32,200 | $24,402 |
| 2023 | $719 | $55,167 | $33,250 | $21,917 |
| 2022 | $1,000 | $45,523 | $25,900 | $19,623 |
| 2021 | $926 | $42,406 | $24,150 | $18,256 |
| 2020 | $857 | $38,393 | $20,650 | $17,743 |
| 2019 | $803 | $34,241 | $17,150 | $17,091 |
| 2018 | $766 | $33,200 | $17,150 | $16,050 |
| 2017 | $1,039 | $31,683 | $15,750 | $15,933 |
| 2016 | $719 | $28,627 | $13,300 | $15,327 |
| 2015 | $716 | $22,563 | $7,700 | $14,863 |
| 2014 | $695 | $20,568 | $5,950 | $14,618 |
Source: Public Records
Map
Nearby Homes
- 6164 Cromwell Ave
- 332 S Mallard St
- 6233 Elton Ave
- 6224 Arlington Ave
- 309 Wisteria Ave
- 6225 Arlington Ave
- 6305 Fairwood Ave
- 329 Wisteria Ave
- 6100 Alamo Cir
- 6325 Burgundy Way
- 6120 Cairo Cir
- 100 S Crestline Dr Unit 17
- 417 Wisteria Ave
- 340 Zion Dr
- 208 Colleen Dr
- 6416 Alta Dr
- 6409 Burgundy Way
- 824 Salem Dr
- 6108 Kimberly Cir
- 5705 Evergreen Ave
- 309 S Wallace Dr
- 317 S Wallace Dr
- 6128 Borden Cir
- 305 S Wallace Dr
- 401 S Wallace Dr
- 6129 Cromwell Cir
- 6140 Arlington Ave
- 6124 Borden Cir
- 6141 Cromwell Ave
- 6129 Borden Cir
- 6125 Cromwell Cir
- 405 S Wallace Dr
- 301 S Wallace Dr
- 6109 Arlington Ave
- 6145 Cromwell Ave
- 6144 Arlington Ave
- 6141 Arlington Ave
- 6120 Borden Cir
- 6125 Borden Cir
- 6128 Cromwell Cir