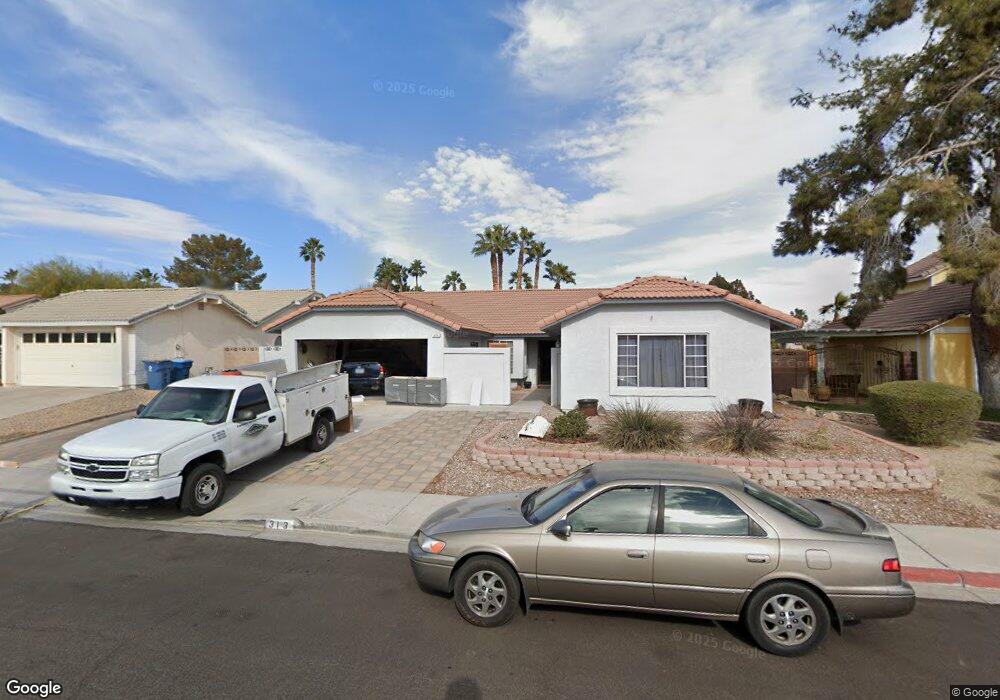
313 Simon Bolivar Dr Henderson, NV 89014
Green Valley North NeighborhoodEstimated Value: $507,000 - $568,000
4
Beds
3
Baths
2,179
Sq Ft
$248/Sq Ft
Est. Value
About This Home
This home is located at 313 Simon Bolivar Dr, Henderson, NV 89014 and is currently estimated at $541,393, approximately $248 per square foot. 313 Simon Bolivar Dr is a home located in Clark County with nearby schools including James Gibson Elementary School, Barbara and Hank Greenspun Junior High School, and Green Valley High School.
Ownership History
Date
Name
Owned For
Owner Type
Purchase Details
Closed on
Mar 27, 2023
Sold by
Siffrinn Stephen J
Bought by
Siffrinn Family Trust
Current Estimated Value
Purchase Details
Closed on
May 24, 2010
Sold by
Beneficial Financial I Inc
Bought by
Siffrinn Stephen J and Siffrinn Loretta I
Home Financials for this Owner
Home Financials are based on the most recent Mortgage that was taken out on this home.
Original Mortgage
$114,900
Interest Rate
4.91%
Mortgage Type
New Conventional
Purchase Details
Closed on
Jan 7, 2010
Sold by
Morse Bryan J and Morse Kimberly R
Bought by
Beneficial Mortgage Co Of Nevada
Purchase Details
Closed on
Jun 7, 2004
Sold by
Nonn David L and Nonn Julie R
Bought by
Morse Bryan J and Morse Kimberly R
Home Financials for this Owner
Home Financials are based on the most recent Mortgage that was taken out on this home.
Original Mortgage
$255,600
Interest Rate
6.09%
Mortgage Type
Unknown
Create a Home Valuation Report for This Property
The Home Valuation Report is an in-depth analysis detailing your home's value as well as a comparison with similar homes in the area
Home Values in the Area
Average Home Value in this Area
Purchase History
| Date | Buyer | Sale Price | Title Company |
|---|---|---|---|
| Siffrinn Family Trust | $483,600 | None Listed On Document | |
| Siffrinn Stephen J | $179,900 | Ticor Title Las Vegas | |
| Beneficial Mortgage Co Of Nevada | $152,090 | Accommodation | |
| Morse Bryan J | $284,000 | United Title Of Nevada |
Source: Public Records
Mortgage History
| Date | Status | Borrower | Loan Amount |
|---|---|---|---|
| Previous Owner | Siffrinn Stephen J | $114,900 | |
| Previous Owner | Morse Bryan J | $255,600 |
Source: Public Records
Tax History Compared to Growth
Tax History
| Year | Tax Paid | Tax Assessment Tax Assessment Total Assessment is a certain percentage of the fair market value that is determined by local assessors to be the total taxable value of land and additions on the property. | Land | Improvement |
|---|---|---|---|---|
| 2025 | $2,331 | $112,522 | $38,500 | $74,022 |
| 2024 | $2,263 | $112,522 | $38,500 | $74,022 |
| 2023 | $2,263 | $109,944 | $39,200 | $70,744 |
| 2022 | $2,198 | $96,362 | $30,800 | $65,562 |
| 2021 | $2,134 | $92,437 | $29,750 | $62,687 |
| 2020 | $2,069 | $91,287 | $28,700 | $62,587 |
| 2019 | $2,008 | $86,177 | $24,150 | $62,027 |
| 2018 | $1,950 | $81,234 | $21,000 | $60,234 |
| 2017 | $2,391 | $82,481 | $21,000 | $61,481 |
| 2016 | $1,847 | $78,472 | $16,450 | $62,022 |
| 2015 | $1,843 | $70,663 | $12,600 | $58,063 |
| 2014 | $1,789 | $59,917 | $8,750 | $51,167 |
Source: Public Records
Map
Nearby Homes
- 1939 Guinn Dr
- 316 Santa Monica Dr
- 1926 Navarre Ln
- 272 Grand Teton Dr
- 2108 Running River Rd
- 347 Gana Ct Unit B
- 372 Rushing Creek Ct
- 259 Spring Hills Ln
- 346 Pinnacle Ct
- 322 Oliveiro Ct
- 1832 Muchacha Dr
- 2150 Running River Rd
- 1831 Escondido Terrace
- 374 Santali Ct
- 371 Legacy Dr
- 327 Fuente Dr
- 1810 Nuevo Rd
- 246 Windsong Dr
- 1809 Nuevo Rd
- 409 Indigo Springs St
- 311 Simon Bolivar Dr
- 315 Simon Bolivar Dr
- 335 Moreno Ct
- 336 Santa Monica Dr
- 317 Simon Bolivar Dr
- 309 Simon Bolivar Dr
- 312 Simon Bolivar Dr
- 310 Simon Bolivar Dr
- 334 Moreno Ct
- 314 Simon Bolivar Dr
- 338 Santa Monica Dr
- 337 Moreno Ct
- 308 Simon Bolivar Dr
- 319 Simon Bolivar Dr
- 316 Simon Bolivar Dr
- 340 Santa Monica Dr
- 336 Moreno Ct
- 318 Simon Bolivar Dr
- 337 Santa Monica Dr