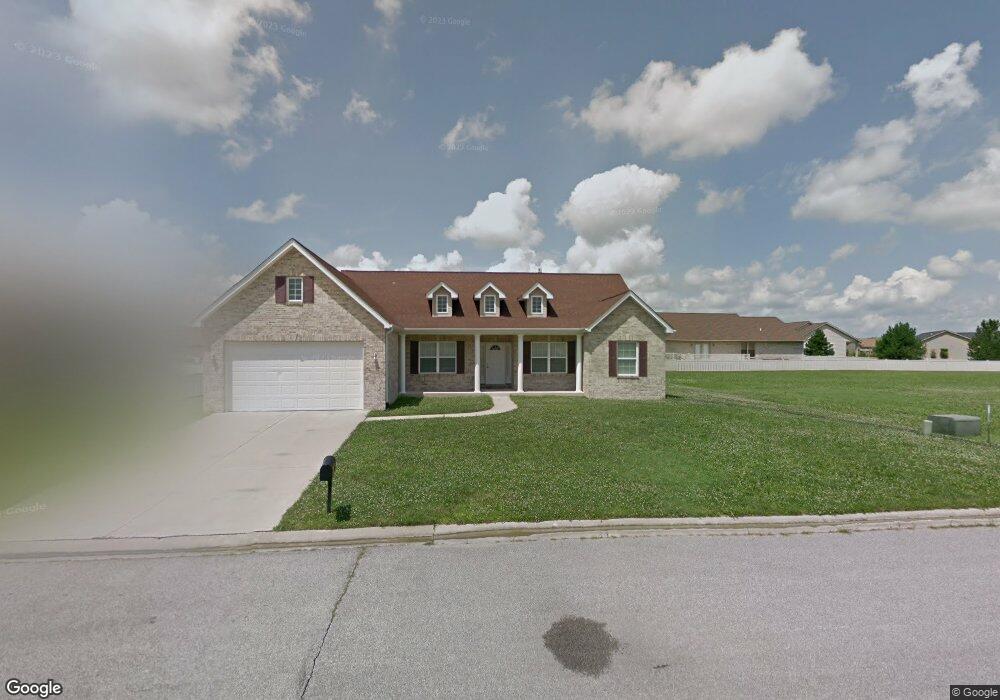
313 Sleeping Indian Dr Freeburg, IL 62243
Estimated Value: $327,103 - $386,000
3
Beds
2
Baths
1,921
Sq Ft
$182/Sq Ft
Est. Value
About This Home
This home is located at 313 Sleeping Indian Dr, Freeburg, IL 62243 and is currently estimated at $348,776, approximately $181 per square foot. 313 Sleeping Indian Dr is a home located in St. Clair County with nearby schools including Freeburg Elementary School, Freeburg Community High School, and St. Joseph Catholic School.
Ownership History
Date
Name
Owned For
Owner Type
Purchase Details
Closed on
Mar 3, 2023
Sold by
Bdp Co V Llc
Bought by
Hennessey Christy and Hennessey James
Current Estimated Value
Home Financials for this Owner
Home Financials are based on the most recent Mortgage that was taken out on this home.
Original Mortgage
$271,491
Outstanding Balance
$263,875
Interest Rate
6.75%
Mortgage Type
FHA
Estimated Equity
$84,901
Purchase Details
Closed on
Aug 9, 2013
Sold by
Bpd Corporation
Bought by
Bpd Company V Llc
Purchase Details
Closed on
Jul 1, 2006
Sold by
Rosa Developers Llc
Bought by
Bpd Corp
Create a Home Valuation Report for This Property
The Home Valuation Report is an in-depth analysis detailing your home's value as well as a comparison with similar homes in the area
Home Values in the Area
Average Home Value in this Area
Purchase History
| Date | Buyer | Sale Price | Title Company |
|---|---|---|---|
| Hennessey Christy | $276,500 | Town & Country Title | |
| Bpd Company V Llc | -- | None Available | |
| Bpd Corp | $117,000 | Chicago Title |
Source: Public Records
Mortgage History
| Date | Status | Borrower | Loan Amount |
|---|---|---|---|
| Open | Hennessey Christy | $271,491 |
Source: Public Records
Tax History Compared to Growth
Tax History
| Year | Tax Paid | Tax Assessment Tax Assessment Total Assessment is a certain percentage of the fair market value that is determined by local assessors to be the total taxable value of land and additions on the property. | Land | Improvement |
|---|---|---|---|---|
| 2024 | $7,602 | $98,059 | $18,867 | $79,192 |
| 2023 | $7,645 | $91,141 | $17,536 | $73,605 |
| 2022 | $7,187 | $83,646 | $16,094 | $67,552 |
| 2021 | $6,920 | $78,762 | $15,154 | $63,608 |
| 2020 | $7,007 | $76,904 | $14,619 | $62,285 |
| 2019 | $6,816 | $76,904 | $14,619 | $62,285 |
| 2018 | $6,581 | $74,210 | $14,107 | $60,103 |
| 2017 | $3,786 | $70,772 | $13,454 | $57,318 |
| 2016 | $1,253 | $68,935 | $13,688 | $55,247 |
| 2014 | $1,083 | $67,836 | $13,470 | $54,366 |
| 2013 | $1,019 | $69,312 | $13,763 | $55,549 |
Source: Public Records
Map
Nearby Homes
- 359 Sleeping Indian Dr
- 304 Torrington Ln
- 363 Sleeping Indian Dr
- 222 Alamosa Dr
- 227 Alamosa Dr
- 420 Foxtail Dr
- 433 Foxtail Dr
- 440 Foxtail Dr
- 302 N Railroad St
- 312 W Phillips St
- 206 N Main St
- 207 N Edison St
- 401 N Edison St
- 520 N Edison St
- 106 S Vine St
- TBB Kraft Rd
- 5433 Kraft Rd
- 3 Park St
- 103 Draco Dr
- 0 Hickory Dr
- 309 Sleeping Indian Dr
- 317 Sleeping Indian Dr
- 312 Torrington Ln
- 316 Torrington Ln
- 308 Torrington Ln
- 312 Sleeping Indian Dr
- 305 Sleeping Indian Dr
- 308 Sleeping Indian Dr
- 321 Sleeping Indian Dr
- 316 Sleeping Indian Dr
- 304 Sleeping Indian Dr
- 320 Torrington Ln
- 320 Sleeping Indian Dr
- 317 Torrington Ln
- 325 Sleeping Indian Dr
- 301 Sleeping Indian Dr
- 313 Torrington Ln
- 313 Glenrock Ln
- 339 Sleeping Indian Dr
- 309 Glenrock Ln