Estimated Value: $218,000 - $243,000
3
Beds
2
Baths
1,200
Sq Ft
$190/Sq Ft
Est. Value
About This Home
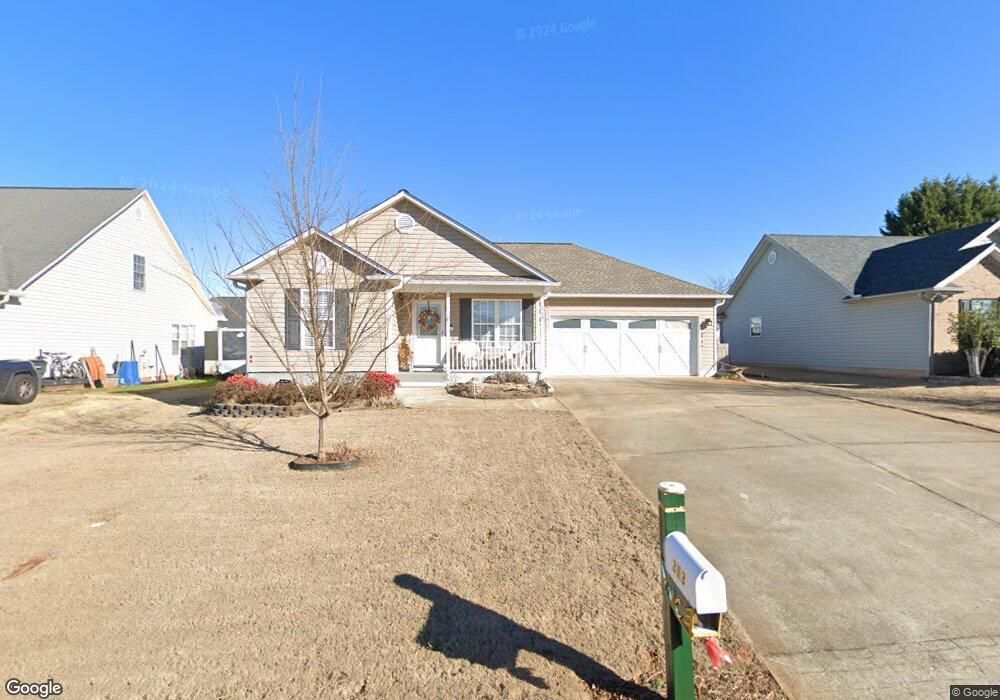
This home is located at 313 Split Oak Ln, Inman, SC 29349 and is currently estimated at $227,618, approximately $189 per square foot. 313 Split Oak Ln is a home located in Spartanburg County with nearby schools including Inman Elementary School, T.E. Mabry Middle School, and Chapman High School.
Ownership History
Date
Name
Owned For
Owner Type
Purchase Details
Closed on
Oct 27, 2015
Sold by
Workman Daniel Keith
Bought by
Delcampo Carl M and Delcampo Christine
Current Estimated Value
Purchase Details
Closed on
Sep 23, 2011
Sold by
Workman Lauren Guyton
Bought by
Workman Daniel Keith
Purchase Details
Closed on
Apr 30, 2007
Sold by
Daystar Builders Inc
Bought by
Workman Daniel Keith and Workman Lauren Guyton
Home Financials for this Owner
Home Financials are based on the most recent Mortgage that was taken out on this home.
Original Mortgage
$107,200
Interest Rate
6.11%
Mortgage Type
Purchase Money Mortgage
Purchase Details
Closed on
Apr 20, 2007
Sold by
Charter Investments Inc
Bought by
Daystar Builders Inc
Home Financials for this Owner
Home Financials are based on the most recent Mortgage that was taken out on this home.
Original Mortgage
$107,200
Interest Rate
6.11%
Mortgage Type
Purchase Money Mortgage
Create a Home Valuation Report for This Property
The Home Valuation Report is an in-depth analysis detailing your home's value as well as a comparison with similar homes in the area
Home Values in the Area
Average Home Value in this Area
Purchase History
| Date | Buyer | Sale Price | Title Company |
|---|---|---|---|
| Delcampo Carl M | $112,500 | None Available | |
| Workman Daniel Keith | -- | -- | |
| Workman Daniel Keith | $107,210 | None Available | |
| Daystar Builders Inc | $18,000 | None Available |
Source: Public Records
Mortgage History
| Date | Status | Borrower | Loan Amount |
|---|---|---|---|
| Previous Owner | Workman Daniel Keith | $107,200 |
Source: Public Records
Tax History
| Year | Tax Paid | Tax Assessment Tax Assessment Total Assessment is a certain percentage of the fair market value that is determined by local assessors to be the total taxable value of land and additions on the property. | Land | Improvement |
|---|---|---|---|---|
| 2022 | $819 | $5,152 | $1,000 | $4,152 |
| 2021 | $803 | $5,152 | $1,000 | $4,152 |
| 2020 | $782 | $5,152 | $1,000 | $4,152 |
| 2019 | $792 | $5,152 | $1,000 | $4,152 |
| 2018 | $1,243 | $5,152 | $1,000 | $4,152 |
| 2017 | $1,061 | $4,496 | $800 | $3,696 |
| 2016 | $1,029 | $4,496 | $800 | $3,696 |
| 2015 | $929 | $4,064 | $800 | $3,264 |
| 2014 | $896 | $4,064 | $800 | $3,264 |
Source: Public Records
Map
Nearby Homes
- 361 Split Oak Ln
- 834 John Weaver Trace
- 381 Split Oak Ln
- 393 Split Oak Ln
- 430 Bud Farmer Place
- 105 Everest Dr
- 107 Everest Dr
- 224 W Clark Rd
- 108 Everest Dr
- 603 Ezra Ct
- 203 Vega St
- 1763 Watersail Ln
- 1304 Dockyard Ln
- 1304 Dockyard Ln Unit CLE 83
- 505 Treasure Cove
- 416 Pisgah Ln
- 72 Blackstock Rd
- 1295 Dockyard Ln Unit CLE 77
- 1295 Dockyard Ln
- 1267 Dockyard Ln Unit CLE 70
- 317 Split Oak Ln
- 309 Split Oak Ln
- 773 Spartan Commodor Ln Lot 3
- 769 Spartan Commodor Ln Lot 4
- 763 Spartan Commodor Ln Lot 5
- 779 Spartan Commodor Ln Lot 2
- 305 Split Oak Ln
- 321 Split Oak Ln
- 222 Serenity Path
- 759 Spartan Commodor Ln Lot 6
- 783 Spartan Commodor Ln Lot 1
- 221 Serenity Path
- 320 Split Oak Ln
- 755 Spartan Commodor Ln Lot 7
- 325 Split Oak Ln
- 216 Serenity Path
- 751 Spartan Commodor Ln Lot 8
- 324 Split Oak Ln
- 871 John Weaver Trace Lot 58
- 213 Serenity Path
Your Personal Tour Guide
Ask me questions while you tour the home.