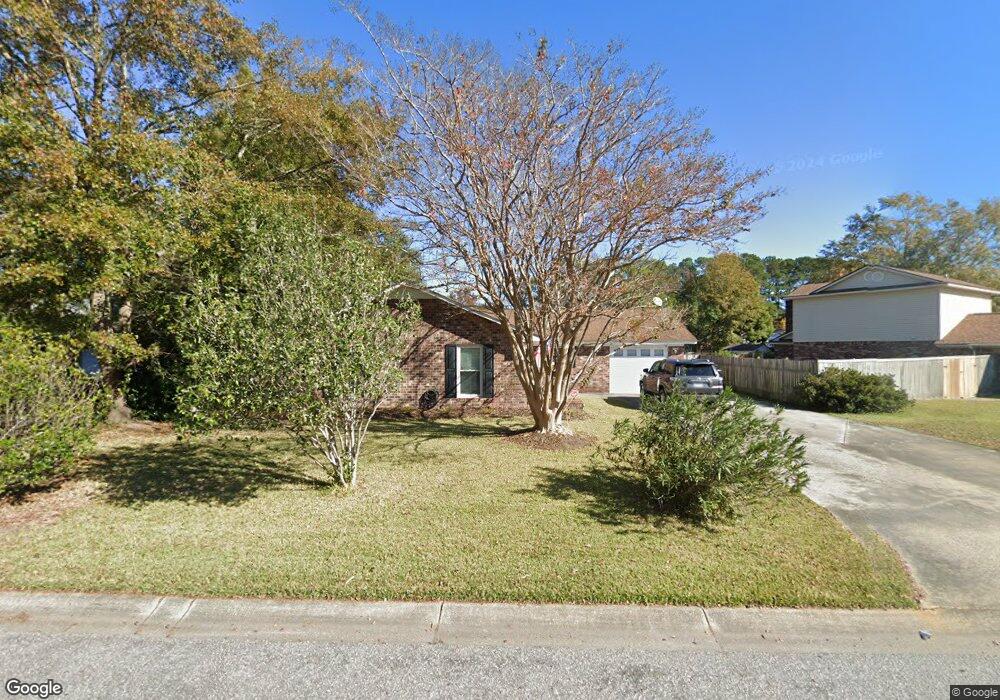
313 Swamp Fox Ln Goose Creek, SC 29445
Estimated Value: $275,069 - $340,000
--
Bed
--
Bath
1,842
Sq Ft
$169/Sq Ft
Est. Value
About This Home
This home is located at 313 Swamp Fox Ln, Goose Creek, SC 29445 and is currently estimated at $311,017, approximately $168 per square foot. 313 Swamp Fox Ln is a home located in Berkeley County with nearby schools including Westview Primary School, Westview Elementary School, and Westview Middle School.
Ownership History
Date
Name
Owned For
Owner Type
Purchase Details
Closed on
Dec 18, 2024
Sold by
Gormel Richard T
Bought by
Gormel Karin J
Current Estimated Value
Purchase Details
Closed on
Nov 1, 2019
Sold by
Berkeley Electric Cooperative Inc
Bought by
Berkeley Electric
Purchase Details
Closed on
Aug 12, 2010
Sold by
Gormel Karin J
Bought by
Gormel Karin J and Gormel Richard T
Purchase Details
Closed on
Jun 16, 2006
Sold by
Mclane Barbara J
Bought by
Gormel Karin J and Mclane Barbara J
Purchase Details
Closed on
Jun 9, 2004
Sold by
Gormel Richard T and Gormel Karin
Bought by
Mclane Barbara J
Purchase Details
Closed on
Jul 18, 2002
Sold by
Gormel Richard T
Bought by
Gormel Richard T and Gormel Karin
Purchase Details
Closed on
Jan 31, 2000
Sold by
Bailey Lee V and Bailey Carissima O
Bought by
Gormel Richard T
Create a Home Valuation Report for This Property
The Home Valuation Report is an in-depth analysis detailing your home's value as well as a comparison with similar homes in the area
Home Values in the Area
Average Home Value in this Area
Purchase History
| Date | Buyer | Sale Price | Title Company |
|---|---|---|---|
| Gormel Karin J | -- | None Listed On Document | |
| Berkeley Electric | $14,000 | None Available | |
| Gormel Karin J | -- | -- | |
| Gormel Karin J | -- | -- | |
| Mclane Ronald J | -- | -- | |
| Gormel Karin J | -- | None Available | |
| Mclane Barbara J | $121,500 | -- | |
| Gormel Richard T | -- | -- | |
| Gormel Richard T | $75,000 | -- |
Source: Public Records
Tax History Compared to Growth
Tax History
| Year | Tax Paid | Tax Assessment Tax Assessment Total Assessment is a certain percentage of the fair market value that is determined by local assessors to be the total taxable value of land and additions on the property. | Land | Improvement |
|---|---|---|---|---|
| 2025 | $792 | $169,412 | $32,726 | $136,686 |
| 2024 | $792 | $10,165 | $1,964 | $8,201 |
| 2023 | $792 | $6,776 | $1,309 | $5,467 |
| 2022 | $739 | $5,892 | $1,359 | $4,533 |
| 2021 | $1,049 | $5,890 | $1,359 | $4,533 |
| 2020 | $1,005 | $5,892 | $1,359 | $4,533 |
| 2019 | $958 | $5,892 | $1,359 | $4,533 |
| 2018 | $877 | $5,124 | $1,200 | $3,924 |
| 2017 | $871 | $5,124 | $1,200 | $3,924 |
| 2016 | $877 | $5,120 | $1,200 | $3,920 |
| 2015 | $828 | $5,120 | $1,200 | $3,920 |
| 2014 | $777 | $5,120 | $1,200 | $3,920 |
| 2013 | -- | $5,120 | $1,200 | $3,920 |
Source: Public Records
Map
Nearby Homes
- 304 Vixen Blvd
- 246 Foxborough Rd
- 216 Foxborough Rd
- 105 Barrington Blvd
- 102 Barrington Blvd
- 107 Guildford Dr
- 113 Rockdale Ln
- 11 Hunters Ct
- 803 Gunston Hall Rd
- 110 N Pembroke Dr
- 369 Old Mount Holly Rd
- 111 Bassett Ct
- 124 Fairbury Dr
- 119 Stratford Dr
- 102 Brush Blvd
- 125 Stonehurst Dr
- 104 S Pembroke Dr
- Lot 3 Thurgood Dr
- 128 Foxborough Rd
- 106 Trimley Ct
- 311 Swamp Fox Ln
- 315 Swamp Fox Ln
- 307 Red Fox Ln
- 309 Swamp Fox Ln
- 323 Swamp Fox Ln
- 309 Red Fox Ln
- 312 Swamp Fox Ln
- 310 Swamp Fox Ln
- 314 Swamp Fox Ln
- 307 Swamp Fox Ln
- 311 Red Fox Ln
- 308 Swamp Fox Ln
- 320 Swamp Fox Ln
- 322 Swamp Fox Ln
- 305 Swamp Fox Ln
- 313 Red Fox Ln
- 316 Swamp Fox Ln
- 324 Swamp Fox Ln
- 318 Swamp Fox Ln
- 306 Swamp Fox Ln