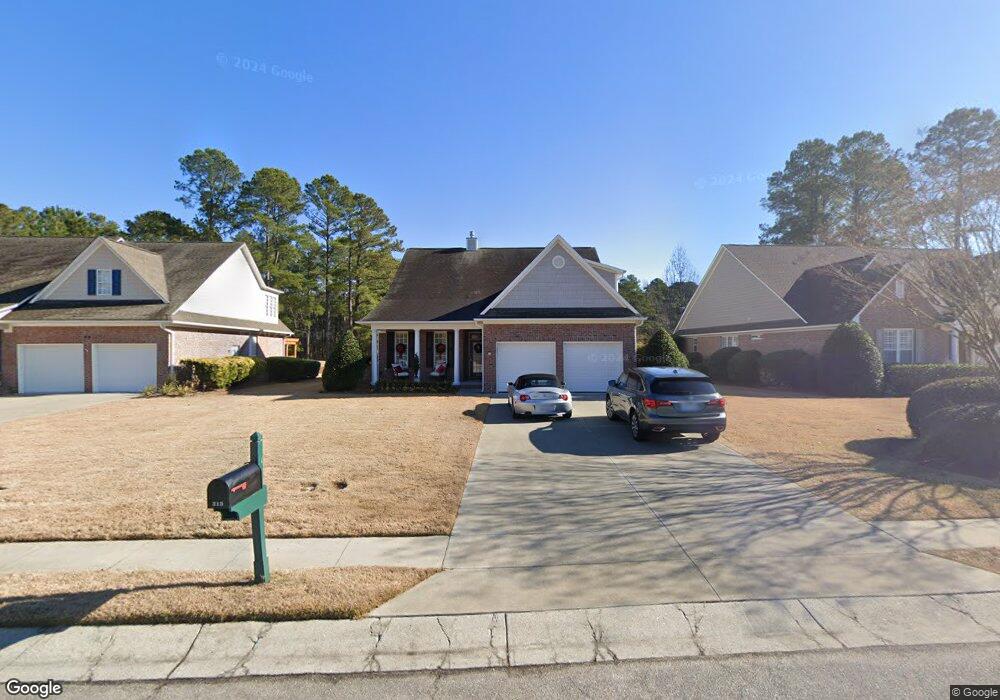
313 Trail Pines Ct Leland, NC 28451
Estimated Value: $526,000 - $540,000
4
Beds
3
Baths
2,690
Sq Ft
$198/Sq Ft
Est. Value
About This Home
This home is located at 313 Trail Pines Ct, Leland, NC 28451 and is currently estimated at $532,150, approximately $197 per square foot. 313 Trail Pines Ct is a home located in Brunswick County with nearby schools including Town Creek Elementary School, North Brunswick High School, and Classical Charter Schools of Leland.
Ownership History
Date
Name
Owned For
Owner Type
Purchase Details
Closed on
Jun 27, 2012
Sold by
Kotecha Linda M and Kotecha Narendra M
Bought by
Kotecha Linda
Current Estimated Value
Home Financials for this Owner
Home Financials are based on the most recent Mortgage that was taken out on this home.
Original Mortgage
$36,600
Outstanding Balance
$5,440
Interest Rate
3.11%
Mortgage Type
New Conventional
Estimated Equity
$526,710
Purchase Details
Closed on
May 16, 2007
Sold by
Hagood Homes Of Wilmington Inc
Bought by
Kotecha Linda
Home Financials for this Owner
Home Financials are based on the most recent Mortgage that was taken out on this home.
Original Mortgage
$250,000
Interest Rate
5.82%
Mortgage Type
New Conventional
Create a Home Valuation Report for This Property
The Home Valuation Report is an in-depth analysis detailing your home's value as well as a comparison with similar homes in the area
Home Values in the Area
Average Home Value in this Area
Purchase History
| Date | Buyer | Sale Price | Title Company |
|---|---|---|---|
| Kotecha Linda | -- | None Available | |
| Kotecha Linda | $386,000 | None Available |
Source: Public Records
Mortgage History
| Date | Status | Borrower | Loan Amount |
|---|---|---|---|
| Open | Kotecha Linda | $36,600 | |
| Closed | Kotecha Linda | $250,000 |
Source: Public Records
Tax History Compared to Growth
Tax History
| Year | Tax Paid | Tax Assessment Tax Assessment Total Assessment is a certain percentage of the fair market value that is determined by local assessors to be the total taxable value of land and additions on the property. | Land | Improvement |
|---|---|---|---|---|
| 2025 | $3,361 | $483,840 | $60,000 | $423,840 |
| 2024 | $3,361 | $483,840 | $60,000 | $423,840 |
| 2023 | $2,900 | $483,840 | $60,000 | $423,840 |
| 2022 | $2,900 | $349,610 | $50,000 | $299,610 |
| 2021 | $2,900 | $349,610 | $50,000 | $299,610 |
| 2020 | $2,515 | $314,450 | $50,000 | $264,450 |
| 2019 | $2,485 | $52,420 | $50,000 | $2,420 |
| 2018 | $2,451 | $86,870 | $84,000 | $2,870 |
| 2017 | $2,451 | $86,870 | $84,000 | $2,870 |
| 2016 | $2,317 | $86,870 | $84,000 | $2,870 |
| 2015 | $2,216 | $316,720 | $84,000 | $232,720 |
| 2014 | $1,793 | $268,226 | $60,000 | $208,226 |
Source: Public Records
Map
Nearby Homes
- 860 Ricefield Branch St NE
- 1098 Hanson Dr
- 1086 Hanson Dr
- 1094 Hanson Dr
- 1082 Hanson Dr
- 1090 Hanson Dr
- 1106 Veranda Ct
- 1334 Hydrangea Ct
- 3146 Redfield Dr
- 1240 Wood Lily Cir
- 1537 Grandiflora Dr
- 1013 Greymoss Ln
- 1005 Greymoss Ln SE
- 9112 Highland Hills Dr
- 1019 Davidson Ave NE
- 1050 Davidson Ave NE
- 1021 Parkwood Dr NE
- 1042 Paddington Ave NE
- 1117 Water Lily
- 1205 Regalia Ln
- 311 Trail Pines Ct
- 315 Trail Pines Ct
- 309 Trail Pines Ct
- 317 Trail Pines Ct
- 305 Trail Pines Ct
- 260 Windchime Way
- 258 Windchime Way
- 303 Trail Pines Ct
- 256 Windchime Way
- 263 Windchime Way
- 254 Windchime Way
- 261 Windchime Way
- 259 Windchime Way
- 241 Morning View Way
- 252 Windchime Way
- 245 Morning View Way
- 255 Windchime Way
- 250 Windchime Way
- 104 Pinegrove Ct
- 106 Pinegrove Ct