NOT LISTED FOR SALE

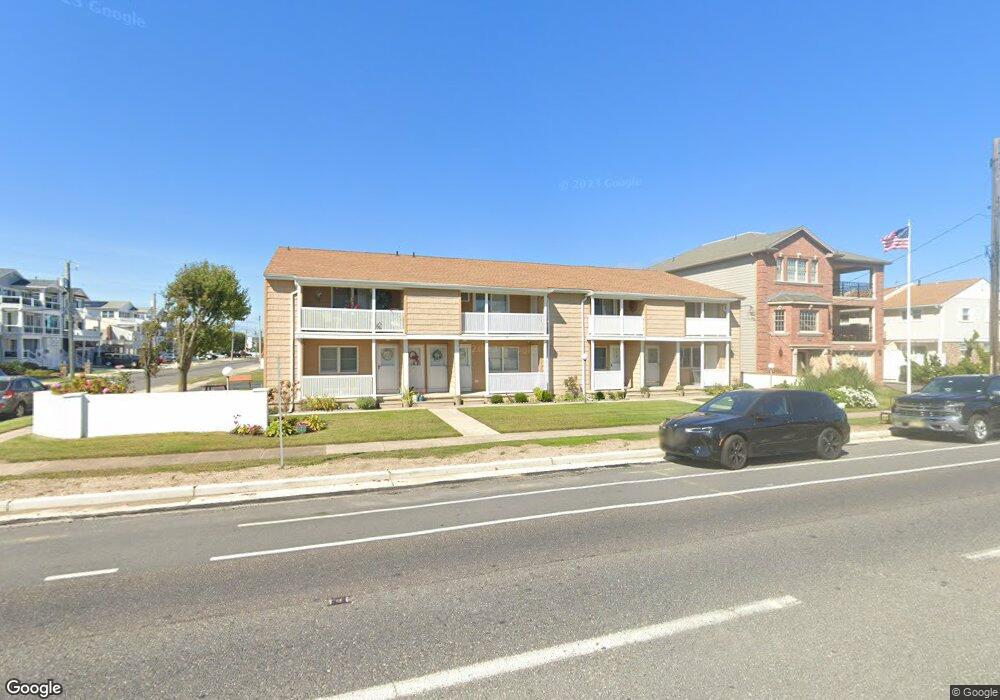
313 W Brigantine Ave Unit 6 Brigantine, NJ 08203

Estimated Value: $461,000 - $580,000

2 Beds
1 Bath
904 Sq Ft
$568/Sq Ft Est. Value

About This Home

This home is located at 313 W Brigantine Ave Unit 6, Brigantine, NJ 08203 and is currently estimated at $513,458, approximately $567 per square foot. 313 W Brigantine Ave Unit 6 is a home located in Atlantic County with nearby schools including Brigantine Elementary School and Brigantine Community School.

Ownership History

Date Name Owned For Owner Type

Purchase Details

Closed on
Aug 4, 2020
Sold by
Mcdonald Stephen E and Mcdonald Joann S
Bought by
Coleman Yolanda Fontanez and Coleman William Thomas
Current Estimated Value
$513,458

Home Financials for this Owner

Home Financials are based on the most recent Mortgage that was taken out on this home.
Original Mortgage
$195,600
Interest Rate
2.8%
Mortgage Type
New Conventional

Purchase Details

Closed on
Jul 18, 2011
Sold by
Ferree Carl D
Bought by
Mcdonald Stephen E and Mcdonald Joann S

Purchase Details

Closed on
Oct 5, 1998
Sold by
Angstadt Thomas P and Angstadt Lou Mecchella
Bought by
Ferree Carla D and Ferree Susan H

Home Financials for this Owner

Home Financials are based on the most recent Mortgage that was taken out on this home.
Original Mortgage
$70,000
Interest Rate
6.57%

Purchase Details

Closed on
Mar 6, 1995
Sold by
Connolly Eileen M and Robbins Eileen M
Bought by
Angstadt Thomas P and Angstadt Lou Mecchella

Range of Values:

Collateral Analytics

Collateral Analytics Collateral Analytics AVMs (Automated Valuation Model) employ a number of statistical approaches combined with neighborhood-specific comparable selection guarantees the most up-to-date and precise valuations.

Not Available

Collateral Analytics does not have data for the current month. Please view the chart for historical values.

ICE

ICE Mortgage Technology ICE Mortgage Technology’s AVM (Automated Valuation Model) is a state-of-the-art online residential property valuation tool that provides a quick and accurate estimate of the value of almost any home in the U.S.

Not Available

ICE Mortgage Technology does not have data for the current month. Please view the chart for historical values.

First American

First American First American Data & Analytics’ next-generation AVM combines unrivaled data assets with a blended ensemble of valuation models to produce highly accurate, reliable valuations you can trust.

Not Available

First American does not have data for the current month. Please view the chart for historical values.

Quantarium

Quantarium Quantarium’s valuation service, repeatedly proven the industry’s most accurate and comprehensive, is supercharged with a self-learning and auto-tuning AI engine that continually becomes smarter and more accurate as it processes daily inputs from the industry’s leading RE data lake.

Not Available

Quantarium does not have data for the current month. Please view the chart for historical values.

Average Value
Not Available
List Price
Sold Price
Create a Home Valuation Report for This Property
The Home Valuation Report is an in-depth analysis detailing your home's value as well as a comparison with similar homes in the area

Home Values in the Area

Source: Public Records

Average Home Value in this Area


Source: Public Records

Purchase History

Date Buyer Sale Price Title Company
Coleman Yolanda Fontanez $244,500 Trident Land Transfer
Mcdonald Stephen E $220,000 Fidelity National Title
Ferree Carla D $89,000 Commonwealth Land Title Ins
Angstadt Thomas P $78,456 The Title Company Of Jersey
Source: Public Records

Mortgage History

Date Status Borrower Loan Amount
Previous Owner Coleman Yolanda Fontanez $195,600
Previous Owner Ferree Carla D $70,000
Source: Public Records

Tax History Compared to Growth

Source: Public Records

Tax History

Year Tax Paid Tax Assessment Tax Assessment Total Assessment is a certain percentage of the fair market value that is determined by local assessors to be the total taxable value of land and additions on the property. Land Improvement
2024 $4,183 $222,500 $182,500 $40,000
2023 $3,865 $222,500 $182,500 $40,000
2022 $3,865 $222,500 $182,500 $40,000
2021 $3,796 $222,500 $182,500 $40,000
2020 $3,756 $222,500 $182,500 $40,000
2019 $3,789 $222,500 $182,500 $40,000
2018 $3,865 $222,500 $182,500 $40,000
2017 $3,927 $222,500 $182,500 $40,000
2016 $3,925 $222,500 $182,500 $40,000
2015 $3,945 $222,500 $182,500 $40,000
2014 $3,798 $222,500 $182,500 $40,000
Source: Public Records

Map