Estimated Value: $188,909 - $216,000
--
Bed
1
Bath
1,308
Sq Ft
$159/Sq Ft
Est. Value
About This Home
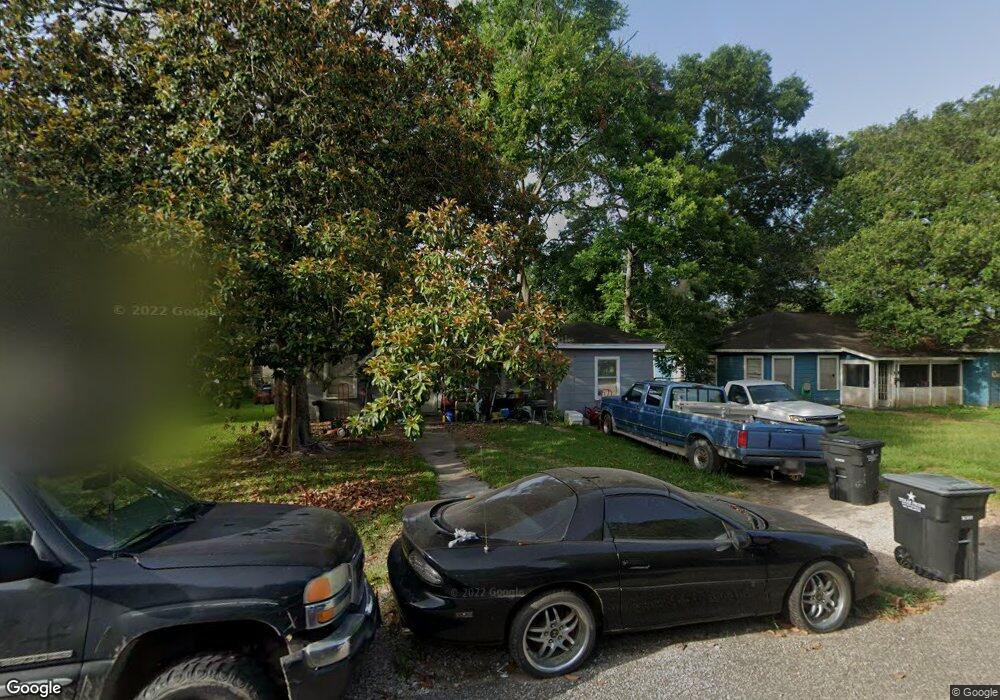
This home is located at 313 W Foley St, Alvin, TX 77511 and is currently estimated at $207,977, approximately $159 per square foot. 313 W Foley St is a home located in Brazoria County with nearby schools including Alvin Elementary School, Fairview Junior High School, and Alvin High School.
Ownership History
Date
Name
Owned For
Owner Type
Purchase Details
Closed on
Jul 14, 2025
Sold by
Anderson Scott Joseph and Lee Dawn
Bought by
Anderson Scott Joseph and Anderson Lee Dawn
Current Estimated Value
Purchase Details
Closed on
Dec 5, 2017
Sold by
Anderson William Ronel and Anderson Donyella Rhea
Bought by
Aderson Scott Joseph
Purchase Details
Closed on
Nov 2, 1994
Sold by
Mid State Trust Ii
Bought by
Jim Walter Homes Inc
Purchase Details
Closed on
Oct 15, 1994
Sold by
Mid State Trust Ii
Bought by
Anderson Ronnie C and Anderson Billie J
Purchase Details
Closed on
Oct 5, 1994
Sold by
Vaughan Richard and Vaughan Sandra K
Bought by
Mid State Trust Ii
Create a Home Valuation Report for This Property
The Home Valuation Report is an in-depth analysis detailing your home's value as well as a comparison with similar homes in the area
Home Values in the Area
Average Home Value in this Area
Purchase History
| Date | Buyer | Sale Price | Title Company |
|---|---|---|---|
| Anderson Scott Joseph | -- | None Listed On Document | |
| Aderson Scott Joseph | -- | None Available | |
| Jim Walter Homes Inc | -- | -- | |
| Anderson Ronnie C | -- | -- | |
| Mid State Trust Ii | -- | -- |
Source: Public Records
Mortgage History
| Date | Status | Borrower | Loan Amount |
|---|---|---|---|
| Closed | Anderson Ronnie C | $0 |
Source: Public Records
Tax History Compared to Growth
Tax History
| Year | Tax Paid | Tax Assessment Tax Assessment Total Assessment is a certain percentage of the fair market value that is determined by local assessors to be the total taxable value of land and additions on the property. | Land | Improvement |
|---|---|---|---|---|
| 2025 | $866 | $89,384 | $20,480 | $76,780 |
| 2023 | $866 | $73,871 | $20,480 | $77,790 |
| 2022 | $1,842 | $67,155 | $20,480 | $52,190 |
| 2021 | $1,763 | $61,050 | $13,650 | $47,400 |
| 2020 | $1,782 | $60,900 | $13,650 | $47,250 |
| 2019 | $1,742 | $58,000 | $13,650 | $44,350 |
| 2018 | $1,745 | $58,000 | $13,650 | $44,350 |
| 2017 | $1,610 | $52,850 | $13,650 | $39,200 |
| 2016 | $1,610 | $52,850 | $13,650 | $39,200 |
| 2015 | $1,271 | $51,990 | $13,650 | $38,340 |
| 2014 | $1,271 | $51,290 | $13,650 | $37,640 |
Source: Public Records
Map
Nearby Homes
- 914 S Hill St
- 1012 S Lee St
- 209 E Foley St
- 1020 S Booth Ln
- 222 E Southland Ave
- 304 E Foley St
- 1216 S Hill St
- 313 E Dumble St
- 1302 Cypress St
- 710 S Jackson St
- 403 S Hill St Unit L
- 417 W Blum St
- 903 Dula St
- 303 S Jackson St
- 816 W Adoue St
- 514 E Foley St
- 225 Foster St
- 2710 Hackberry Run
- 412 W Sidnor St
- 4602 Cottonwood Run