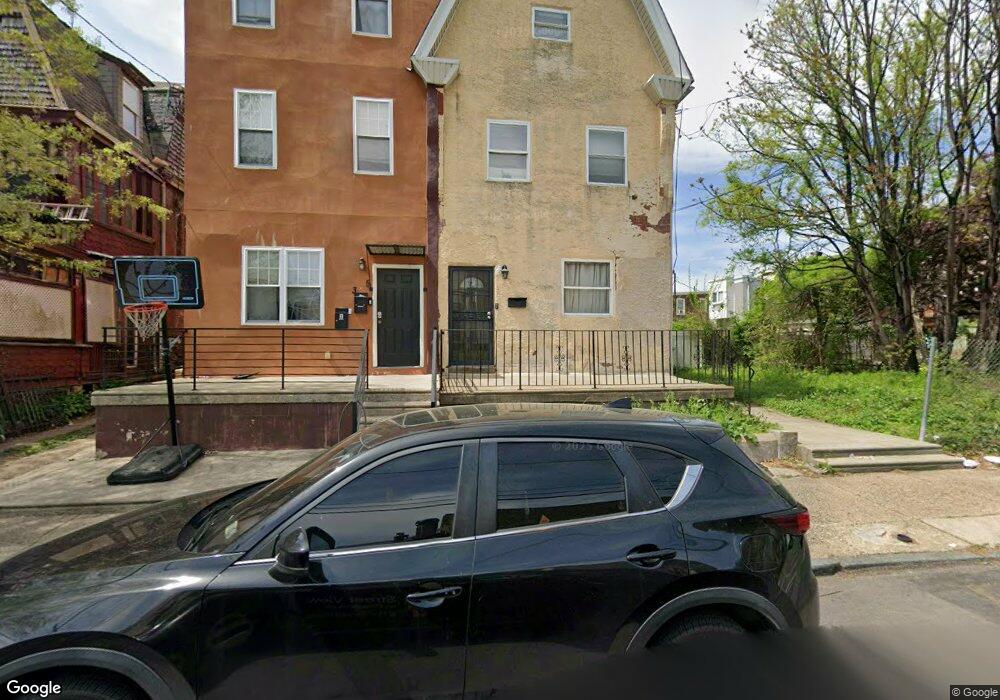
313 W Hansberry St Philadelphia, PA 19144
Germantown NeighborhoodEstimated Value: $221,000 - $348,000
6
Beds
2
Baths
2,358
Sq Ft
$115/Sq Ft
Est. Value
About This Home
This home is located at 313 W Hansberry St, Philadelphia, PA 19144 and is currently estimated at $271,017, approximately $114 per square foot. 313 W Hansberry St is a home located in Philadelphia County with nearby schools including John B. Kelly School, Martin Luther King High School, and Queen Lane Montessori School.
Ownership History
Date
Name
Owned For
Owner Type
Purchase Details
Closed on
Nov 15, 2018
Sold by
Howard Angelica
Bought by
Howard Kennedy Lafaye Aija
Current Estimated Value
Purchase Details
Closed on
Nov 24, 2015
Sold by
Us Bank Na
Bought by
Howard Angelica
Purchase Details
Closed on
Jul 17, 2012
Sold by
Williams Jewell and Vignola Joseph C
Bought by
Us Bank National Association
Purchase Details
Closed on
Nov 27, 2007
Sold by
Polack Alexander
Bought by
Cook Aisha L
Home Financials for this Owner
Home Financials are based on the most recent Mortgage that was taken out on this home.
Original Mortgage
$130,945
Interest Rate
6.48%
Mortgage Type
FHA
Purchase Details
Closed on
Aug 24, 2005
Sold by
Grinberg Boris and Grinberg Zisel
Bought by
Polack Alexander
Home Financials for this Owner
Home Financials are based on the most recent Mortgage that was taken out on this home.
Original Mortgage
$86,250
Interest Rate
5.79%
Mortgage Type
Fannie Mae Freddie Mac
Purchase Details
Closed on
Aug 18, 2003
Sold by
Walton Achelohiym and Weaver Carrie
Bought by
Grinberg Boris and Grinberg Zisel
Create a Home Valuation Report for This Property
The Home Valuation Report is an in-depth analysis detailing your home's value as well as a comparison with similar homes in the area
Home Values in the Area
Average Home Value in this Area
Purchase History
| Date | Buyer | Sale Price | Title Company |
|---|---|---|---|
| Howard Kennedy Lafaye Aija | $2,000 | None Available | |
| Howard Angelica | $45,000 | Diversified Settlement Servi | |
| Us Bank National Association | $5,700 | None Available | |
| Cook Aisha L | $133,000 | None Available | |
| Polack Alexander | $115,000 | Chicago Title Insurance Co | |
| Grinberg Boris | $12,100 | -- |
Source: Public Records
Mortgage History
| Date | Status | Borrower | Loan Amount |
|---|---|---|---|
| Previous Owner | Cook Aisha L | $130,945 | |
| Previous Owner | Polack Alexander | $86,250 |
Source: Public Records
Tax History Compared to Growth
Tax History
| Year | Tax Paid | Tax Assessment Tax Assessment Total Assessment is a certain percentage of the fair market value that is determined by local assessors to be the total taxable value of land and additions on the property. | Land | Improvement |
|---|---|---|---|---|
| 2025 | $2,254 | $201,200 | $40,240 | $160,960 |
| 2024 | $2,254 | $201,200 | $40,240 | $160,960 |
| 2023 | $2,254 | $161,000 | $32,200 | $128,800 |
| 2022 | $1,524 | $161,000 | $32,200 | $128,800 |
| 2021 | $1,524 | $0 | $0 | $0 |
| 2020 | $1,524 | $0 | $0 | $0 |
| 2019 | $1,592 | $0 | $0 | $0 |
| 2018 | $1,233 | $0 | $0 | $0 |
| 2017 | $1,233 | $0 | $0 | $0 |
| 2016 | $1,233 | $0 | $0 | $0 |
| 2015 | -- | $0 | $0 | $0 |
| 2014 | -- | $102,100 | $18,889 | $83,211 |
| 2012 | -- | $11,072 | $2,548 | $8,524 |
Source: Public Records
Map
Nearby Homes
- 260 W Queen Ln
- 332 W Queen Ln
- 5138 Newhall St
- 333 W Hansberry St
- 232 W Penn St
- 230 W Penn St
- 5128 Newhall St
- 5238 Morris St
- 5351 Newhall St
- 5204 Morris St
- 5322 Wayne Ave
- 5125 Newhall St
- 5347 Priscilla St
- 5349 Priscilla St
- 337 W Penn St
- 5225 Mckean Ave
- 300 W Coulter St
- 247 W Coulter St
- 417 W Penn St
- 302 W Earlham Terrace
- 315 W Hansberry St
- 311 W Hansberry St
- 317 W Hansberry St
- 319 W Hansberry St
- 5204 Pulaski Ave
- 5206 Pulaski Ave
- 5208 Pulaski Ave
- 5202 Pulaski Ave
- 5210 Pulaski Ave
- 321 W Hansberry St
- 5200 Pulaski Ave
- 323 W Hansberry St
- 5214 Pulaski Ave
- 325 W Hansberry St
- 5216 Pulaski Ave
- 5212 Pulaski Ave
- 327 W Hansberry St
- 5218 Pulaski Ave
- 5220 Pulaski Ave
- 329 W Hansberry St