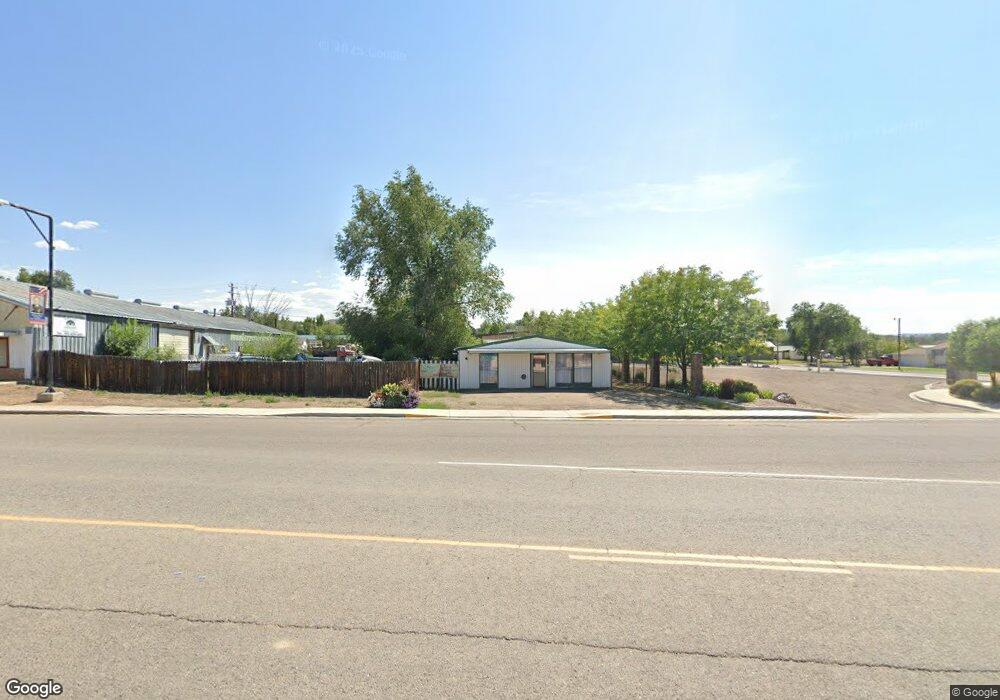
313 W Main St Rangely, CO 81648
Estimated Value: $68,498
Studio
1
Bath
1,920
Sq Ft
$36/Sq Ft
Est. Value
About This Home
This home is located at 313 W Main St, Rangely, CO 81648 and is currently estimated at $68,498, approximately $35 per square foot. 313 W Main St is a home located in Rio Blanco County with nearby schools including Parkview Elementary School, Rangely Junior/Senior High School, and Rangely Christian Academy.
Ownership History
Date
Name
Owned For
Owner Type
Purchase Details
Closed on
Jun 21, 2023
Sold by
Brasfield Joey L and Brasfield Christine L
Bought by
Grogg Chloe E
Current Estimated Value
Home Financials for this Owner
Home Financials are based on the most recent Mortgage that was taken out on this home.
Original Mortgage
$52,500
Outstanding Balance
$43,403
Interest Rate
6.35%
Mortgage Type
New Conventional
Estimated Equity
$25,095
Create a Home Valuation Report for This Property
The Home Valuation Report is an in-depth analysis detailing your home's value as well as a comparison with similar homes in the area
Home Values in the Area
Average Home Value in this Area
Purchase History
| Date | Buyer | Sale Price | Title Company |
|---|---|---|---|
| Grogg Chloe E | -- | None Listed On Document |
Source: Public Records
Mortgage History
| Date | Status | Borrower | Loan Amount |
|---|---|---|---|
| Open | Grogg Chloe E | $52,500 |
Source: Public Records
Tax History
| Year | Tax Paid | Tax Assessment Tax Assessment Total Assessment is a certain percentage of the fair market value that is determined by local assessors to be the total taxable value of land and additions on the property. | Land | Improvement |
|---|---|---|---|---|
| 2024 | $1,583 | $6,270 | $5,270 | $1,000 |
| 2023 | $527 | $6,270 | $5,270 | $1,000 |
| 2022 | $995 | $13,630 | $5,480 | $8,150 |
| 2021 | $971 | $13,630 | $5,480 | $8,150 |
| 2020 | $1,034 | $14,490 | $5,480 | $9,010 |
| 2019 | $972 | $14,490 | $5,480 | $9,010 |
| 2018 | $911 | $14,550 | $5,480 | $9,070 |
| 2017 | $1,016 | $14,550 | $5,480 | $9,070 |
| 2016 | $956 | $14,260 | $5,480 | $8,780 |
| 2015 | $803 | $14,260 | $0 | $0 |
| 2014 | $803 | $14,520 | $0 | $0 |
| 2013 | $870 | $14,520 | $0 | $0 |
| 2012 | $870 | $15,690 | $5,480 | $10,210 |
Source: Public Records
Map
Nearby Homes
- 302 W Main St
- 203 Dakota Ave
- 115 S Jones Ave
- 206 E Rangely Ave
- 251 E Raven Ave
- 243 Crest St
- 1100 Tanglewood Ln
- 515 Lake St
- 1215 La Mesa Cir
- 1235 La Mesa Cir
- 1225 La Mesa Cir
- 1210 La Mesa Cir
- 1542 La Mesa Cir
- 1250 Deserado Dr
- 1351 La Mesa Cir
- 0 County Road 101
- 0 Tbd Highway 40
- 0 Cr 104
- 0 3rd St Unit 10-12
- 801 Blue Mountain Ave
- 119 S Sunset Ave
- 125 S Sunset Ave
- 322 W Main St
- 302 W Main St Unit 107 N. Sunset
- 131 S Sunset Ave
- 313 W Rio Blanco Ave
- 307 W Rio Blanco Ave
- 319 W Rio Blanco Ave
- 135 S Sunset Ave
- 109 S Stanolind Ave
- S Sunset Ave
- 128 S Sunset Ave
- 139 S Sunset Ave
- 203 W Main St
- 203 W Main St
- 221 W Rio Blanco Ave
- 146 S Sunset Ave
- 143 S Sunset Ave
- 215 W Rio Blanco Ave
- 148 S Sunset Ave
Your Personal Tour Guide
Ask me questions while you tour the home.