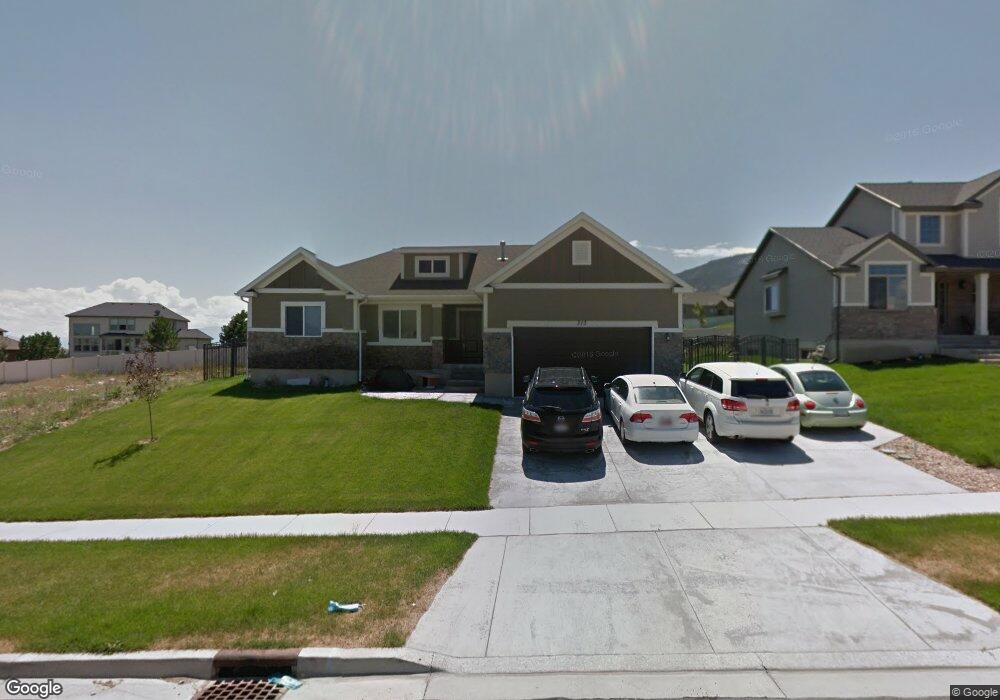
313 W Shadow Ridge Dr Saratoga Springs, UT 84045
Estimated Value: $661,000 - $705,000
6
Beds
4
Baths
3,852
Sq Ft
$177/Sq Ft
Est. Value
About This Home
This home is located at 313 W Shadow Ridge Dr, Saratoga Springs, UT 84045 and is currently estimated at $683,503, approximately $177 per square foot. 313 W Shadow Ridge Dr is a home located in Utah County with nearby schools including Sage Hills Elementary School, Lake Mountain Middle School, and Westlake High School.
Ownership History
Date
Name
Owned For
Owner Type
Purchase Details
Closed on
May 16, 2016
Sold by
Forbush M Don
Bought by
Gillespie Robert
Current Estimated Value
Home Financials for this Owner
Home Financials are based on the most recent Mortgage that was taken out on this home.
Original Mortgage
$332,500
Interest Rate
3.71%
Mortgage Type
New Conventional
Purchase Details
Closed on
Feb 20, 2014
Sold by
Crosby Dian
Bought by
Forbush M Don
Purchase Details
Closed on
Feb 24, 2012
Sold by
Candlelight Homes Llc
Bought by
Crosby Dian
Purchase Details
Closed on
Sep 14, 2011
Sold by
Stillwater Property Ii Llc
Bought by
Candlelight Homes Llc
Home Financials for this Owner
Home Financials are based on the most recent Mortgage that was taken out on this home.
Original Mortgage
$187,325
Interest Rate
4.37%
Mortgage Type
Construction
Purchase Details
Closed on
Oct 14, 2009
Sold by
Steffensen David
Bought by
Rfr Holdings Llc and Mnl Holdings Llc
Create a Home Valuation Report for This Property
The Home Valuation Report is an in-depth analysis detailing your home's value as well as a comparison with similar homes in the area
Home Values in the Area
Average Home Value in this Area
Purchase History
| Date | Buyer | Sale Price | Title Company |
|---|---|---|---|
| Gillespie Robert | -- | Pioneer Title Insurnace Agen | |
| Gillespie Robert | -- | Pioneer Title Ins Agency | |
| Forbush M Don | -- | None Available | |
| Crosby Dian | -- | Advanced Title | |
| Crosby Dian | -- | Advanced Title | |
| Candlelight Homes Llc | -- | Advanced Title | |
| Rfr Holdings Llc | -- | None Available |
Source: Public Records
Mortgage History
| Date | Status | Borrower | Loan Amount |
|---|---|---|---|
| Previous Owner | Gillespie Robert | $332,500 | |
| Previous Owner | Candlelight Homes Llc | $187,325 |
Source: Public Records
Tax History Compared to Growth
Tax History
| Year | Tax Paid | Tax Assessment Tax Assessment Total Assessment is a certain percentage of the fair market value that is determined by local assessors to be the total taxable value of land and additions on the property. | Land | Improvement |
|---|---|---|---|---|
| 2025 | $2,692 | $633,200 | $225,600 | $407,600 |
| 2024 | $2,692 | $323,400 | $0 | $0 |
| 2023 | $2,559 | $330,495 | $0 | $0 |
| 2022 | $2,846 | $358,490 | $0 | $0 |
| 2021 | $2,444 | $459,600 | $127,300 | $332,300 |
| 2020 | $2,346 | $433,200 | $113,700 | $319,500 |
| 2019 | $2,141 | $409,400 | $110,300 | $299,100 |
| 2018 | $2,152 | $388,400 | $103,400 | $285,000 |
| 2017 | $2,091 | $201,905 | $0 | $0 |
| 2016 | $2,010 | $180,125 | $0 | $0 |
| 2015 | $1,966 | $167,145 | $0 | $0 |
| 2014 | $1,903 | $159,940 | $0 | $0 |
Source: Public Records
Map
Nearby Homes
- 2702 S Spring Meadow Dr
- 2559 S Colt Dr
- 2787 S Spring Meadow Dr
- 413 W Birch Dr Unit 532
- 2499 S Maverick Rd
- 127 W Honeysuckle Dr Unit 221
- 153 W Honeysuckle Dr
- 2493 S Aster Way
- 2387 S Maverick Rd W
- 388 W Peppergrass Way
- 501 W Fox Hollow Dr
- 161 W Sweetbriar Ln
- 2954 S Fox Pointe Dr
- 2987 S Willow Creek Dr
- 323 W Willow Creek Dr
- 7323 N Long Dr Unit 607
- 2956 S Willow Creek Dr
- 111 E Palmer Ln
- 107 E Palmer Ln
- 2868 S Cottontail Loop
- 323 W Shadow Ridge Dr
- 303 W Shadow Ridge Dr Unit 547
- 293 W Shadow Ridge Dr
- 306 W Shadow Ridge Dr
- 316 W Shadow Ridge Dr
- 296 W Shadow Ridge Dr
- 326 W Shadow Ridge Dr Unit 504
- 326 W Shadow Ridge Dr
- 341 W Shadow Ridge Dr
- 356 W Shadow Ridge Dr
- 324 W Stillwater Dr
- 334 W Stillwater Dr Unit 416
- 287 W Shadow Ridge Dr Unit 408
- 287 W Shadow Ridge Dr
- 314 W Stillwater Dr
- 334 W Shadow Ridge Dr
- 344 W Stillwater Dr
- 288 W Shadow Ridge Dr
- 288 W Shadow Ridge Dr Unit 407
- 284 W Summerhill Dr