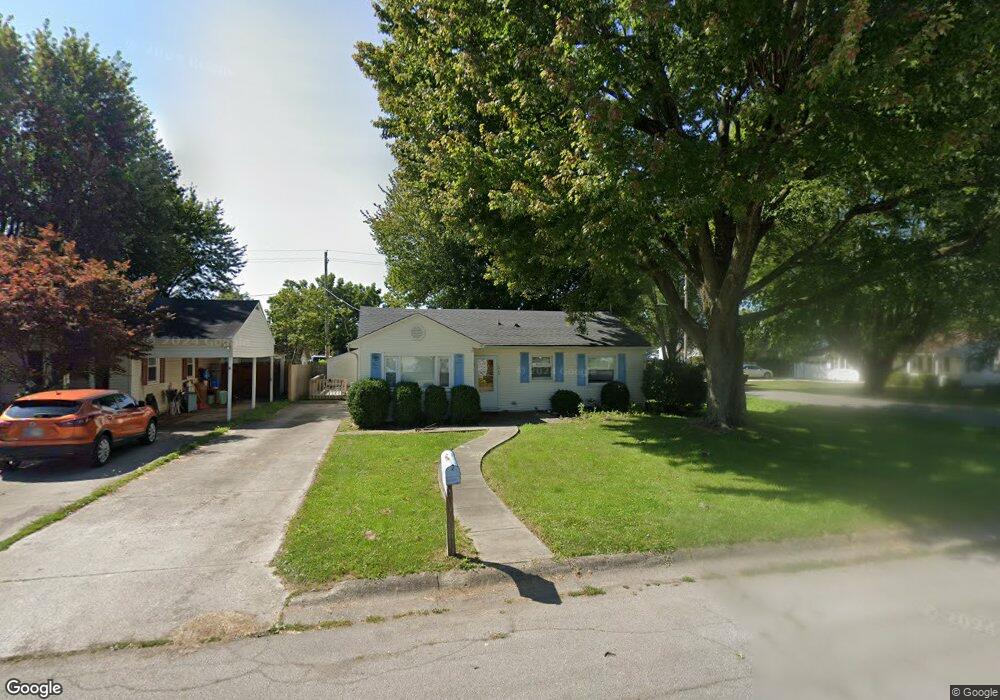
313 W Sycamore St Centerville, IN 47330
Estimated Value: $129,000 - $161,000
3
Beds
2
Baths
1,252
Sq Ft
$116/Sq Ft
Est. Value
About This Home
This home is located at 313 W Sycamore St, Centerville, IN 47330 and is currently estimated at $145,584, approximately $116 per square foot. 313 W Sycamore St is a home located in Wayne County with nearby schools including Rose Hamilton Elementary School, Centerville-Abington Elementary School, and Centerville-Abington Junior High School.
Ownership History
Date
Name
Owned For
Owner Type
Purchase Details
Closed on
Aug 17, 2017
Sold by
Davis Paul D and Davis Tammy M
Bought by
Davis Paul D and Tammy M Davis Irrevocable Trust
Current Estimated Value
Purchase Details
Closed on
Aug 4, 2011
Sold by
Secretary Of Hud
Bought by
Davis Paul O and Davis Tammy M
Home Financials for this Owner
Home Financials are based on the most recent Mortgage that was taken out on this home.
Original Mortgage
$28,968
Interest Rate
4.54%
Mortgage Type
Purchase Money Mortgage
Purchase Details
Closed on
Nov 16, 2010
Sold by
Us Bank Na
Bought by
Secretary Of Hud
Purchase Details
Closed on
May 26, 2010
Sold by
Callaway Jeremy M and Kennedy Ghea J
Bought by
Us Bank Na
Purchase Details
Closed on
May 5, 2006
Sold by
Aughe Nicholas R and Aughe Maralee W
Bought by
Callaway Jeremy M and Kennedy Ghea J
Home Financials for this Owner
Home Financials are based on the most recent Mortgage that was taken out on this home.
Original Mortgage
$91,267
Interest Rate
6.54%
Mortgage Type
FHA
Create a Home Valuation Report for This Property
The Home Valuation Report is an in-depth analysis detailing your home's value as well as a comparison with similar homes in the area
Home Values in the Area
Average Home Value in this Area
Purchase History
| Date | Buyer | Sale Price | Title Company |
|---|---|---|---|
| Davis Paul D | -- | None Available | |
| Davis Paul O | -- | -- | |
| Secretary Of Hud | -- | -- | |
| Us Bank Na | $109,858 | -- | |
| Callaway Jeremy M | -- | -- |
Source: Public Records
Mortgage History
| Date | Status | Borrower | Loan Amount |
|---|---|---|---|
| Previous Owner | Davis Paul O | $28,968 | |
| Previous Owner | Callaway Jeremy M | $91,267 |
Source: Public Records
Tax History
| Year | Tax Paid | Tax Assessment Tax Assessment Total Assessment is a certain percentage of the fair market value that is determined by local assessors to be the total taxable value of land and additions on the property. | Land | Improvement |
|---|---|---|---|---|
| 2024 | $1,246 | $62,300 | $14,100 | $48,200 |
| 2023 | $11 | $56,200 | $12,700 | $43,500 |
| 2022 | $1,116 | $55,800 | $12,400 | $43,400 |
| 2021 | $1,032 | $51,600 | $12,400 | $39,200 |
| 2020 | $1,050 | $52,500 | $12,100 | $40,400 |
| 2019 | $1,050 | $52,500 | $12,100 | $40,400 |
| 2018 | $944 | $47,200 | $12,100 | $35,100 |
| 2017 | $964 | $48,200 | $12,100 | $36,100 |
| 2016 | $938 | $46,900 | $11,700 | $35,200 |
| 2014 | $726 | $36,300 | $11,100 | $25,200 |
| 2013 | $726 | $46,600 | $11,100 | $35,500 |
Source: Public Records
Map
Nearby Homes
- 206 W School St
- 504 S Mcminn Rd
- 139 W Main St
- 122 W Main St
- 120 W Main St
- 1664 S Centerville Rd
- 214 E School St
- 311 E South St
- 314 E School St
- 403 Beech Ave
- 600 E South St
- 606 E South St
- 502 N 1st St
- 409 Mattie Harris Rd
- 200 Winding Brook Dr
- 400 Winding Brook Dr
- 207 College Corner Rd
- 0 Airport Rd Unit 10039926
- 4529 Virginia Ave SW
- 4520 Blue Heron Dr
- 311 W Sycamore St
- 411 Willow Grove Rd
- 309 W Sycamore St
- 500 Willow Grove Rd
- 502 Willow Grove Rd
- 314 W Sycamore St
- 409 Willow Grove Rd
- 506 Willow Grove Rd
- 307 W Sycamore St
- 412 Willow Grove Rd
- 312 W Sycamore St
- 408 Willow Grove Rd
- 405 W Sycamore St
- 305 W Sycamore St
- 310 W Sycamore St
- 405 Willow Grove Rd
- 404 W Sycamore St
- 308 W Sycamore St
- 407 W Sycamore St
- 303 W Sycamore St
Your Personal Tour Guide
Ask me questions while you tour the home.