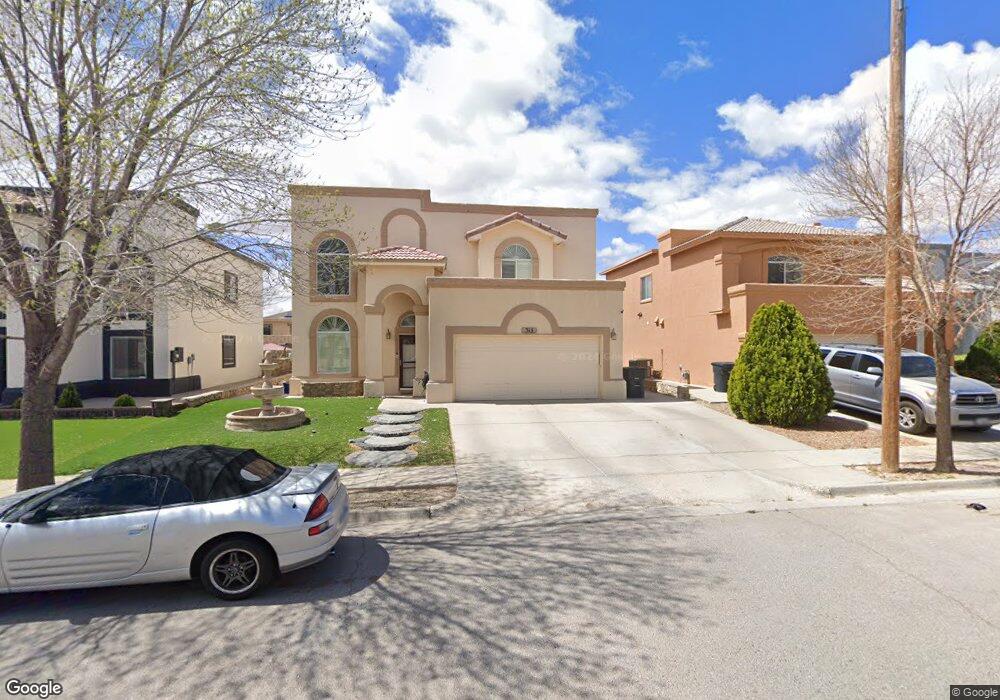
313 Warren Belin Dr El Paso, TX 79928
Estimated Value: $226,000 - $242,000
4
Beds
3
Baths
1,773
Sq Ft
$133/Sq Ft
Est. Value
About This Home
This home is located at 313 Warren Belin Dr, El Paso, TX 79928 and is currently estimated at $235,161, approximately $132 per square foot. 313 Warren Belin Dr is a home located in El Paso County with nearby schools including Desert Hills Elementary School, Horizon Middle School, and Horizon High School.
Ownership History
Date
Name
Owned For
Owner Type
Purchase Details
Closed on
Jan 26, 2021
Sold by
Medeiros June M and Peralta June Michelle
Bought by
Heredia Judith and Heredia Jesus Andres
Current Estimated Value
Home Financials for this Owner
Home Financials are based on the most recent Mortgage that was taken out on this home.
Original Mortgage
$164,858
Outstanding Balance
$147,191
Interest Rate
2.6%
Mortgage Type
FHA
Estimated Equity
$87,970
Purchase Details
Closed on
Jun 30, 2012
Sold by
Peralta Louie
Bought by
Peralta June Michelle
Purchase Details
Closed on
Dec 20, 2006
Sold by
Saratoga Homes Horizon Lp
Bought by
Peralta June M
Home Financials for this Owner
Home Financials are based on the most recent Mortgage that was taken out on this home.
Original Mortgage
$28,460
Interest Rate
6.2%
Mortgage Type
Stand Alone Second
Create a Home Valuation Report for This Property
The Home Valuation Report is an in-depth analysis detailing your home's value as well as a comparison with similar homes in the area
Home Values in the Area
Average Home Value in this Area
Purchase History
| Date | Buyer | Sale Price | Title Company |
|---|---|---|---|
| Heredia Judith | -- | None Available | |
| Peralta June Michelle | -- | None Available | |
| Peralta June M | -- | None Available |
Source: Public Records
Mortgage History
| Date | Status | Borrower | Loan Amount |
|---|---|---|---|
| Open | Heredia Judith | $164,858 | |
| Previous Owner | Peralta June M | $28,460 | |
| Previous Owner | Peralta June M | $113,840 |
Source: Public Records
Tax History Compared to Growth
Tax History
| Year | Tax Paid | Tax Assessment Tax Assessment Total Assessment is a certain percentage of the fair market value that is determined by local assessors to be the total taxable value of land and additions on the property. | Land | Improvement |
|---|---|---|---|---|
| 2025 | $6,202 | $229,165 | $23,980 | $205,185 |
| 2024 | $6,202 | $229,165 | $23,980 | $205,185 |
| 2023 | $6,202 | $211,815 | $23,980 | $187,835 |
| 2022 | $6,235 | $192,289 | $23,980 | $168,309 |
| 2021 | $5,049 | $165,479 | $23,980 | $141,499 |
| 2020 | $4,468 | $128,638 | $23,980 | $104,658 |
| 2018 | $4,285 | $127,664 | $23,980 | $103,684 |
| 2017 | $3,927 | $118,275 | $23,980 | $94,295 |
| 2016 | $3,927 | $118,275 | $23,980 | $94,295 |
| 2015 | $3,518 | $118,275 | $23,980 | $94,295 |
| 2014 | $3,518 | $118,404 | $23,980 | $94,424 |
Source: Public Records
Map
Nearby Homes
- 14156 Warren Belin Dr
- 475 N Kenazo Ave
- 467 N Kenazo Ave
- 14117 Highweed Dr
- 14100 Ghost Flower St
- 14052 Highweed Dr
- 317 Jim Knowles Place
- 409 Desert Chicory St
- 14032 Highweed Dr
- 444 Ghost Flower St
- 441 Desert Dandelion St
- 14005 Lago Azul St
- 0 Highweed Dr Unit 918787
- 394 Brill Cir
- TBD Rodman St
- 156 Lago Grande Dr
- 13977 Veny Webb St
- 14300 Steve Joyce Pkwy
- 14301 Steve Joyce Pkwy
- 14301 Seth Payne Dr
- 309 Warren Belin Dr
- 317 Warren Belin Dr
- 312 De Palma Place
- 308 De Palma Place
- 14153 Warren Belin Dr
- 316 De Palma Place
- 14149 Warren Belin Dr
- 001 N Kenazo
- 312 Warren Belin Dr
- 320 De Palma Place
- 316 Warren Belin Dr
- 325 Warren Belin Dr
- 308 Warren Belin Dr
- 14145 Warren Belin Dr
- 320 Warren Belin Dr
- 304 Warren Belin Dr
- 299 N Kenazo Ave
- 324 De Palma Place
- 300 Warren Belin Dr
- 324 Warren Belin Dr