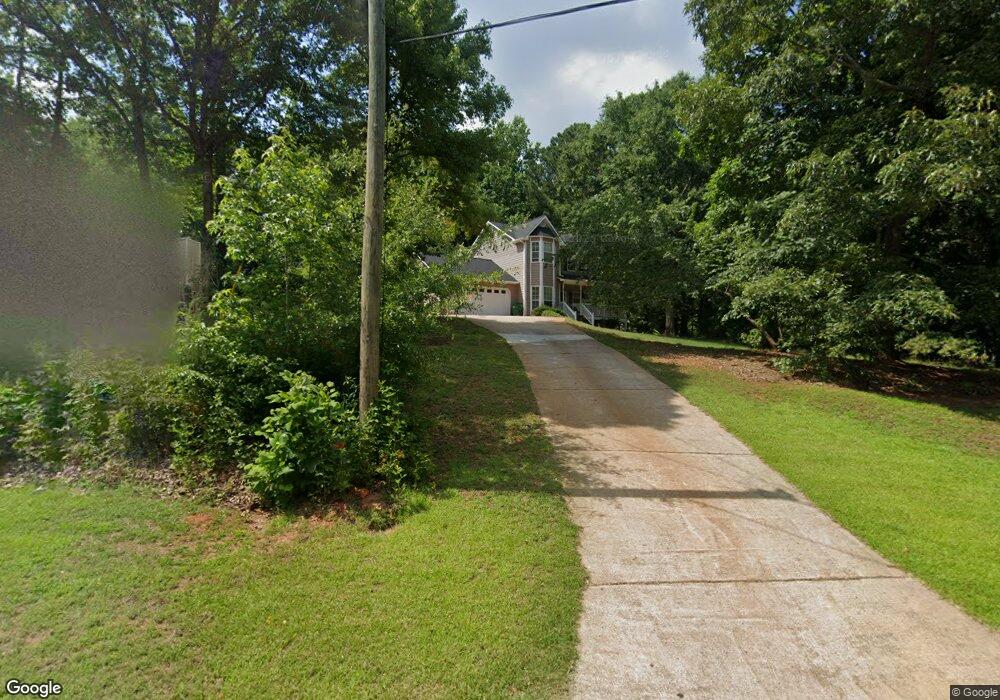
313 Westchester Way Unit 1A Canton, GA 30115
Union Hill NeighborhoodEstimated Value: $332,000 - $345,029
3
Beds
3
Baths
1,544
Sq Ft
$219/Sq Ft
Est. Value
About This Home
This home is located at 313 Westchester Way Unit 1A, Canton, GA 30115 and is currently estimated at $338,515, approximately $219 per square foot. 313 Westchester Way Unit 1A is a home located in Cherokee County with nearby schools including Holly Springs Elementary School, Rusk Middle School, and Sequoyah High School.
Ownership History
Date
Name
Owned For
Owner Type
Purchase Details
Closed on
Oct 25, 2016
Sold by
Tah Holding Lp
Bought by
Tah 2016 1 Borrower Llc
Current Estimated Value
Purchase Details
Closed on
Jan 5, 2016
Sold by
Bugg Jimmy W
Bought by
Tah Holding Lp
Purchase Details
Closed on
Feb 17, 2000
Sold by
Carson John G and Carson Cheryl L
Bought by
Brown Robert L and Brown Christie A
Home Financials for this Owner
Home Financials are based on the most recent Mortgage that was taken out on this home.
Original Mortgage
$110,430
Interest Rate
8.21%
Purchase Details
Closed on
Mar 1, 1993
Sold by
Admiral Construction
Bought by
Carson John G
Home Financials for this Owner
Home Financials are based on the most recent Mortgage that was taken out on this home.
Original Mortgage
$71,150
Interest Rate
8.02%
Create a Home Valuation Report for This Property
The Home Valuation Report is an in-depth analysis detailing your home's value as well as a comparison with similar homes in the area
Home Values in the Area
Average Home Value in this Area
Purchase History
| Date | Buyer | Sale Price | Title Company |
|---|---|---|---|
| Tah 2016 1 Borrower Llc | -- | -- | |
| Tah Holding Lp | $145,500 | -- | |
| Brown Robert L | $120,000 | -- | |
| Carson John G | $94,900 | -- |
Source: Public Records
Mortgage History
| Date | Status | Borrower | Loan Amount |
|---|---|---|---|
| Previous Owner | Brown Robert L | $110,430 | |
| Previous Owner | Carson John G | $71,150 |
Source: Public Records
Tax History Compared to Growth
Tax History
| Year | Tax Paid | Tax Assessment Tax Assessment Total Assessment is a certain percentage of the fair market value that is determined by local assessors to be the total taxable value of land and additions on the property. | Land | Improvement |
|---|---|---|---|---|
| 2025 | $3,388 | $129,028 | $30,800 | $98,228 |
| 2024 | $2,820 | $108,504 | $28,000 | $80,504 |
| 2023 | $2,820 | $108,504 | $28,000 | $80,504 |
| 2022 | $2,852 | $108,504 | $28,000 | $80,504 |
| 2021 | $2,525 | $88,956 | $21,600 | $67,356 |
| 2020 | $2,251 | $79,208 | $17,000 | $62,208 |
| 2019 | $2,032 | $71,520 | $16,000 | $55,520 |
| 2018 | $1,869 | $65,360 | $14,000 | $51,360 |
| 2017 | $1,675 | $145,500 | $14,000 | $44,200 |
| 2016 | $1,675 | $143,800 | $12,800 | $44,720 |
| 2015 | $1,592 | $135,400 | $12,800 | $41,360 |
| 2014 | $1,467 | $124,500 | $12,800 | $37,000 |
Source: Public Records
Map
Nearby Homes
- 555 Lower Birmingham Rd
- 254 Pine Trail
- 1265 Morgan Rd
- 332 Pine Acres Dr Unit 12
- 1180 Springs Dr
- 312 Lady Slipper Ln
- 6023 Jonathan Trace
- 404 Billings Farm Dr
- 826 Hampton Way
- 1053 Walnut Creek Dr Unit I
- 528 Wisteria Dr
- 557 Hickory Rd
- 479 Bradshaw Ln
- 1855 Doefield St
- 506 Charles Dr
- 2527 Hickory Rd
- 2065 Fairway Crossing Dr Unit IVA
- 313 Westchester Way
- 317 Dunesbury Ln Unit Lot 5
- 317 Dunesbury Ln
- 309 Westchester Way
- 0 Dunesbury Ln Unit 8282238
- 310 Westchester Way
- 329 Dunesbury Ln Unit 1B
- 321 Dunesbury Ln
- 305 Westchester Way
- 314 Westchester Way Unit 1A
- 306 Westchester Way Unit 1A
- 325 Dunesbury Ln Unit 1B
- 318 Westchester Way
- 326 Westchester Way Unit 1B
- 1128 Chesterwick Trace Unit 1A
- 301 Westchester Way Unit 1A
- 333 Westchester Way Unit 1B
- 1129 Chesterwick Trace
- 0 Ranchwood Trail
- 330 Westchester Way Unit 1B