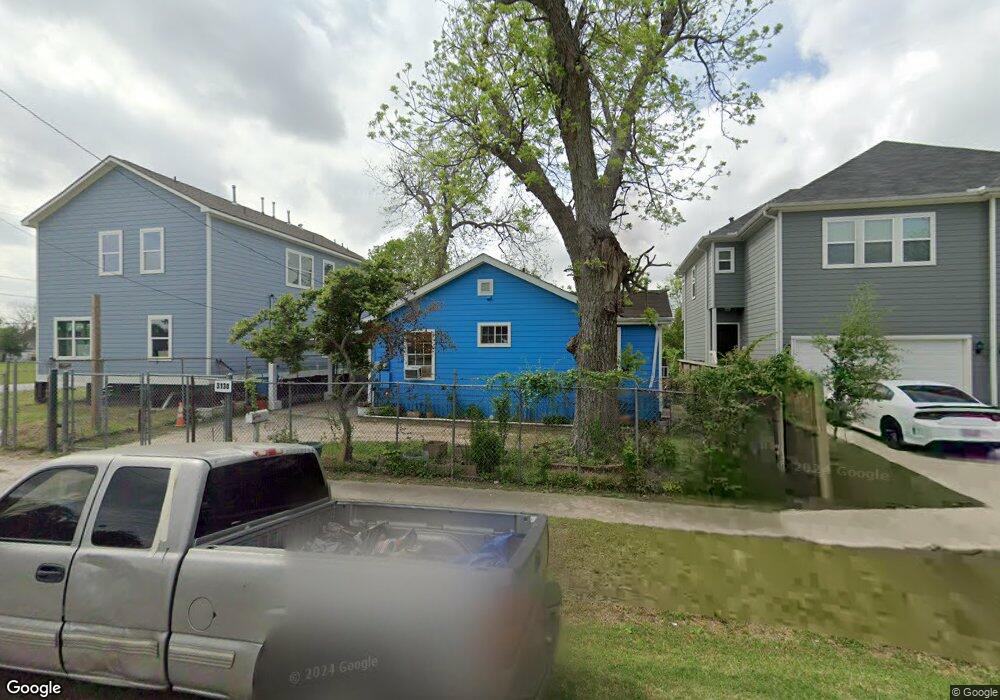
3130 Coal St Houston, TX 77026
Kashmere Gardens NeighborhoodEstimated Value: $168,178 - $196,000
3
Beds
2
Baths
1,174
Sq Ft
$155/Sq Ft
Est. Value
About This Home
This home is located at 3130 Coal St, Houston, TX 77026 and is currently estimated at $181,545, approximately $154 per square foot. 3130 Coal St is a home located in Harris County with nearby schools including Ross Elementary School, Key Middle, and Kashmere High School.
Ownership History
Date
Name
Owned For
Owner Type
Purchase Details
Closed on
Jun 25, 2024
Sold by
Organicpath Investments Llc
Bought by
Empresa Investment Group Llc
Current Estimated Value
Home Financials for this Owner
Home Financials are based on the most recent Mortgage that was taken out on this home.
Original Mortgage
$169,779
Interest Rate
6.72%
Mortgage Type
Seller Take Back
Purchase Details
Closed on
Aug 1, 2023
Sold by
Williams Benjamin K and Ha Benjamin H
Bought by
Code L Studios Llc
Purchase Details
Closed on
Dec 12, 2020
Sold by
Reyes Luis Alonso and Reyes Louis Alonso
Bought by
Reyes Lesly Y
Purchase Details
Closed on
Aug 29, 2007
Sold by
Cruz Joel and Cruz Freida
Bought by
Reyes Luis Alonso
Create a Home Valuation Report for This Property
The Home Valuation Report is an in-depth analysis detailing your home's value as well as a comparison with similar homes in the area
Home Values in the Area
Average Home Value in this Area
Purchase History
| Date | Buyer | Sale Price | Title Company |
|---|---|---|---|
| Empresa Investment Group Llc | -- | None Listed On Document | |
| Code L Studios Llc | $711,000 | None Listed On Document | |
| Reyes Lesly Y | -- | Stewart Title | |
| Reyes Luis Alonso | -- | None Available |
Source: Public Records
Mortgage History
| Date | Status | Borrower | Loan Amount |
|---|---|---|---|
| Previous Owner | Empresa Investment Group Llc | $169,779 |
Source: Public Records
Tax History Compared to Growth
Tax History
| Year | Tax Paid | Tax Assessment Tax Assessment Total Assessment is a certain percentage of the fair market value that is determined by local assessors to be the total taxable value of land and additions on the property. | Land | Improvement |
|---|---|---|---|---|
| 2025 | $3,002 | $122,025 | $64,711 | $57,314 |
| 2024 | $3,002 | $143,475 | $56,270 | $87,205 |
| 2023 | $3,002 | $133,628 | $46,423 | $87,205 |
| 2022 | $2,585 | $117,380 | $30,949 | $86,431 |
| 2021 | $2,392 | $102,629 | $30,949 | $71,680 |
| 2020 | $2,485 | $102,629 | $30,949 | $71,680 |
| 2019 | $3,322 | $131,283 | $21,101 | $110,182 |
| 2018 | $1,795 | $70,942 | $14,068 | $56,874 |
| 2017 | $1,794 | $70,942 | $14,068 | $56,874 |
| 2016 | $1,329 | $52,578 | $11,254 | $41,324 |
| 2015 | $1,352 | $52,578 | $11,254 | $41,324 |
| 2014 | $1,352 | $52,578 | $11,254 | $41,324 |
Source: Public Records
Map
Nearby Homes
- 3114 Cavalcade St Unit 2
- 3110 Memel St
- 3317 Cavalcade St
- 3310 Cavalcade St
- 3313 Cavalcade St
- 4501 Cavalcade St
- 3418 Memel St
- 0 Memel St
- 4215 East Ln
- 0 Cordon St
- 4611 W Hunting St
- 3606 Chickering St
- 3414 Le Badie St
- 3102 Christie St
- 3540 Des Chaumes St
- 2915 Crane St Unit A-B
- 2917 Crane St Unit C-D
- 3413 Hardie St
- 3717 Sayers St
- 4108 Falls St