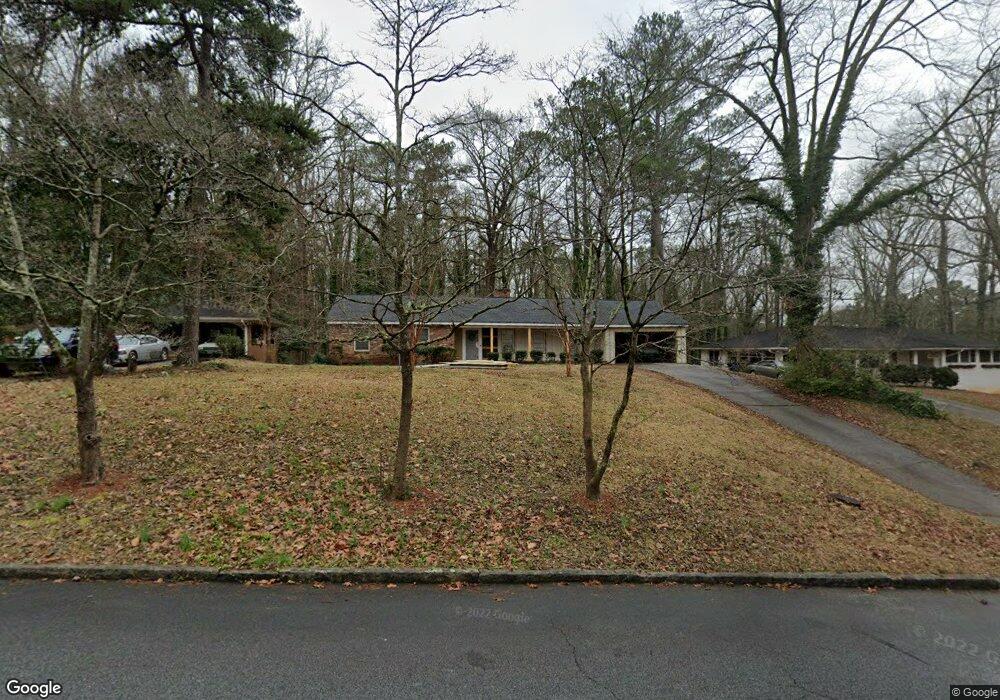
3130 Ivan Hill Dr SW Unit 21 Atlanta, GA 30311
Estimated Value: $204,000 - $293,000
3
Beds
2
Baths
1,581
Sq Ft
$166/Sq Ft
Est. Value
About This Home
This home is located at 3130 Ivan Hill Dr SW Unit 21, Atlanta, GA 30311 and is currently estimated at $262,652, approximately $166 per square foot. 3130 Ivan Hill Dr SW Unit 21 is a home located in Fulton County with nearby schools including West Manor Elementary School, Young Middle School, and Mays High School.
Ownership History
Date
Name
Owned For
Owner Type
Purchase Details
Closed on
Mar 21, 2014
Sold by
Hemphill Faith Neal
Bought by
Smith Angela
Current Estimated Value
Home Financials for this Owner
Home Financials are based on the most recent Mortgage that was taken out on this home.
Original Mortgage
$76,095
Outstanding Balance
$57,480
Interest Rate
4.25%
Mortgage Type
FHA
Estimated Equity
$205,172
Purchase Details
Closed on
Jun 21, 2010
Sold by
Hemphill G W
Bought by
Hemphill Faith N
Purchase Details
Closed on
Nov 16, 2007
Sold by
Washington Mutual Bank
Bought by
Hemphill G W
Home Financials for this Owner
Home Financials are based on the most recent Mortgage that was taken out on this home.
Original Mortgage
$106,110
Interest Rate
6.36%
Mortgage Type
New Conventional
Purchase Details
Closed on
Feb 6, 2007
Sold by
Heard Rosalyn
Bought by
Washington Mutual Bank
Create a Home Valuation Report for This Property
The Home Valuation Report is an in-depth analysis detailing your home's value as well as a comparison with similar homes in the area
Home Values in the Area
Average Home Value in this Area
Purchase History
| Date | Buyer | Sale Price | Title Company |
|---|---|---|---|
| Smith Angela | $77,500 | -- | |
| Hemphill Faith N | $59,900 | -- | |
| Hemphill G W | $117,900 | -- | |
| Washington Mutual Bank | $119,700 | -- |
Source: Public Records
Mortgage History
| Date | Status | Borrower | Loan Amount |
|---|---|---|---|
| Open | Smith Angela | $76,095 | |
| Closed | Smith Angela | $5,000 | |
| Previous Owner | Hemphill G W | $106,110 |
Source: Public Records
Tax History Compared to Growth
Tax History
| Year | Tax Paid | Tax Assessment Tax Assessment Total Assessment is a certain percentage of the fair market value that is determined by local assessors to be the total taxable value of land and additions on the property. | Land | Improvement |
|---|---|---|---|---|
| 2025 | $1,183 | $81,880 | $28,520 | $53,360 |
| 2023 | $4,084 | $98,640 | $39,200 | $59,440 |
| 2022 | $643 | $73,880 | $23,480 | $50,400 |
| 2021 | $601 | $71,760 | $22,800 | $48,960 |
| 2020 | $311 | $49,560 | $8,560 | $41,000 |
| 2019 | $497 | $40,000 | $7,560 | $32,440 |
| 2018 | $347 | $39,080 | $7,400 | $31,680 |
| 2017 | $37 | $21,360 | $4,000 | $17,360 |
| 2016 | $37 | $21,360 | $4,000 | $17,360 |
| 2015 | $555 | $21,360 | $4,000 | $17,360 |
| 2014 | $698 | $15,400 | $2,960 | $12,440 |
Source: Public Records
Map
Nearby Homes
- 3080 Lynhurst Cir SW
- 459 Thackery Place SW Unit I
- 579 Fielding Ln SW
- 3175 W Manor Cir SW
- 650 Lynhurst Dr SW
- 668 Lynn Cir SW Unit 3
- 659 Lynn Valley Rd SW
- 400 Brownlee Rd SW
- 668 Fielding Ln SW
- 716 Lynn Valley Rd SW
- 761 Lynn Cir SW
- 844 Venture Way
- 852 Venture Way SW
- 3390 Cedar Island Dr SW
- 512 Peyton Rd SW
- 847 Venture Way SW
- 3152 Boulder Park Dr SW
- 3211 Hollydale Dr SW
- 3130 Ivan Hill Dr SW
- 3140 Ivan Hill Dr SW
- 3120 Ivan Hill Dr SW
- 3150 Ivan Hill Dr SW
- 3125 Ivan Hill Dr SW
- 3135 Ivan Hill Dr SW
- 3145 Ivan Hill Dr SW
- 467 Ivan Hill Cir SW
- 477 Ivan Hill Cir SW
- 3115 Ivan Hill Dr SW
- 0 Ivan Hill Dr SW Unit 8141200
- 0 Ivan Hill Dr SW Unit 8504033
- 0 Ivan Hill Dr SW Unit 7016181
- 0 Ivan Hill Dr SW
- 487 Ivan Hill Cir SW
- 462 Lynhurst Dr SW
- 450 Lynhurst Dr SW
- 476 Lynhurst Dr SW
- 3105 Ivan Hill Dr SW
- 486 Lynhurst Dr SW