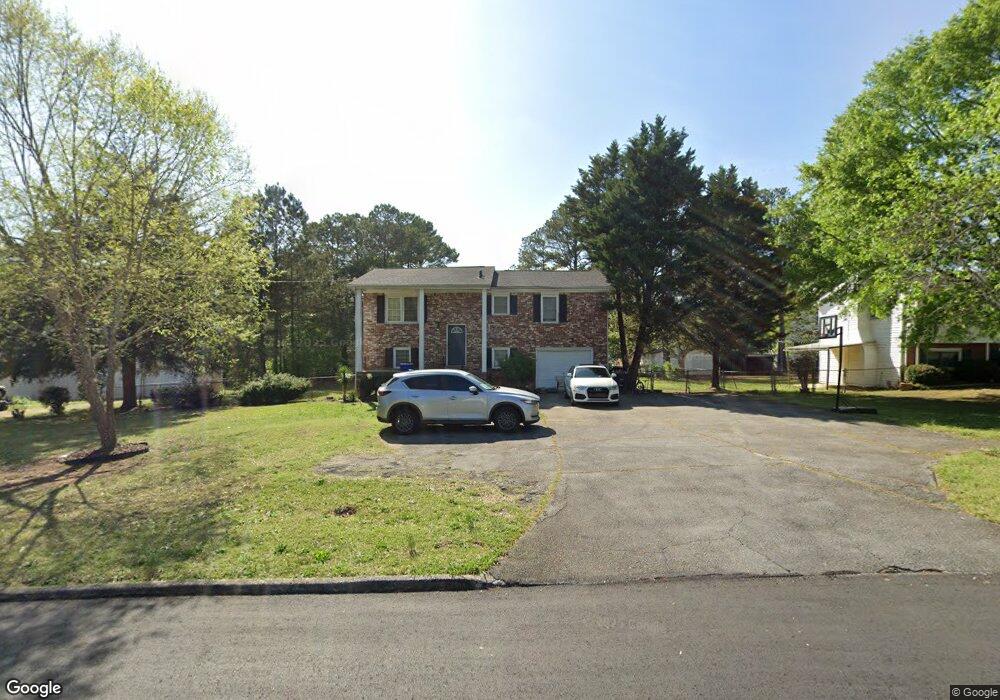
3130 Kipling Dr Powder Springs, GA 30127
Estimated Value: $263,419 - $296,000
3
Beds
2
Baths
960
Sq Ft
$290/Sq Ft
Est. Value
About This Home
This home is located at 3130 Kipling Dr, Powder Springs, GA 30127 and is currently estimated at $278,355, approximately $289 per square foot. 3130 Kipling Dr is a home located in Cobb County with nearby schools including Compton Elementary School, Tapp Middle School, and McEachern High School.
Ownership History
Date
Name
Owned For
Owner Type
Purchase Details
Closed on
Dec 7, 2009
Sold by
Harding Kirk
Bought by
Moore-Waldon Tedra L and Waldon Jonathan
Current Estimated Value
Home Financials for this Owner
Home Financials are based on the most recent Mortgage that was taken out on this home.
Original Mortgage
$94,261
Outstanding Balance
$61,580
Interest Rate
5.01%
Mortgage Type
FHA
Estimated Equity
$216,775
Purchase Details
Closed on
Apr 29, 1997
Sold by
Dashiell Realty Inc
Bought by
Harding Kirk
Home Financials for this Owner
Home Financials are based on the most recent Mortgage that was taken out on this home.
Original Mortgage
$77,761
Interest Rate
7.98%
Mortgage Type
FHA
Purchase Details
Closed on
Oct 28, 1993
Sold by
Avoc Financial Serv Ga
Bought by
Dashiel Realty Inc
Home Financials for this Owner
Home Financials are based on the most recent Mortgage that was taken out on this home.
Original Mortgage
$27,100
Interest Rate
6.95%
Mortgage Type
FHA
Create a Home Valuation Report for This Property
The Home Valuation Report is an in-depth analysis detailing your home's value as well as a comparison with similar homes in the area
Home Values in the Area
Average Home Value in this Area
Purchase History
| Date | Buyer | Sale Price | Title Company |
|---|---|---|---|
| Moore-Waldon Tedra L | $96,000 | -- | |
| Harding Kirk | $78,500 | -- | |
| Dashiel Realty Inc | $17,300 | -- |
Source: Public Records
Mortgage History
| Date | Status | Borrower | Loan Amount |
|---|---|---|---|
| Open | Moore-Waldon Tedra L | $94,261 | |
| Previous Owner | Harding Kirk | $77,761 | |
| Previous Owner | Dashiel Realty Inc | $27,100 | |
| Closed | Dashiel Realty Inc | $22,663 |
Source: Public Records
Tax History Compared to Growth
Tax History
| Year | Tax Paid | Tax Assessment Tax Assessment Total Assessment is a certain percentage of the fair market value that is determined by local assessors to be the total taxable value of land and additions on the property. | Land | Improvement |
|---|---|---|---|---|
| 2025 | $1,542 | $75,148 | $16,000 | $59,148 |
| 2024 | $1,543 | $75,148 | $16,000 | $59,148 |
| 2023 | $1,306 | $86,828 | $8,000 | $78,828 |
| 2022 | $1,840 | $88,124 | $8,000 | $80,124 |
| 2021 | $1,198 | $58,776 | $8,000 | $50,776 |
| 2020 | $918 | $45,996 | $8,000 | $37,996 |
| 2019 | $918 | $45,996 | $8,000 | $37,996 |
| 2018 | $776 | $39,492 | $8,000 | $31,492 |
| 2017 | $759 | $39,492 | $8,000 | $31,492 |
| 2016 | $488 | $27,068 | $8,000 | $19,068 |
| 2015 | $415 | $23,256 | $8,000 | $15,256 |
| 2014 | $229 | $16,532 | $0 | $0 |
Source: Public Records
Map
Nearby Homes
- 3309 Dilmus Dr
- 3314 Dilmus Dr
- 4021 Evelyn Dr
- 3501 Mustang Dr
- 3485 Mustang Dr Unit 4
- 3967 Evelyn Dr
- 3415 Hopkins Rd Unit 1
- 0000 Hopkins Rd
- 3927 Buck Rd
- 3865 Shelleydale Dr Unit 82
- 3215 Dogwood Dr
- 3700 Ashley Woods Dr
- 3904 Shelleydale Dr
- 3908 Shelleydale Dr Unit 39
- 3614 Josh Ct
- 3712 Cheswolde Ave Unit 97
- 3255 Caley Mill Dr
- 3905 Shelleydale Dr
- 3120 Kipling Dr
- 3140 Kipling Dr
- 3141 Kipling Dr
- 3110 Kipling Dr
- 3121 Kipling Dr Unit 2
- 3150 Kipling Dr Unit 2
- 3304 Lancer Dr
- 3111 Kipling Dr
- 3300 Lancer Dr
- 3308 Lancer Dr Unit 2
- 3151 Kipling Dr
- 3312 Lancer Dr
- 3160 Kipling Dr
- 3292 Lancer Dr
- 3101 Kipling Dr Unit 2
- 3284 Lancer Dr
- 3276 Lancer Dr
- 3276 Lancer Dr Unit 2
- 3205 Calcutta Ct Unit 2
- 3201 Calcutta Ct