Estimated Value: $433,405 - $533,000
Studio
--
Bath
1,493
Sq Ft
$320/Sq Ft
Est. Value
About This Home
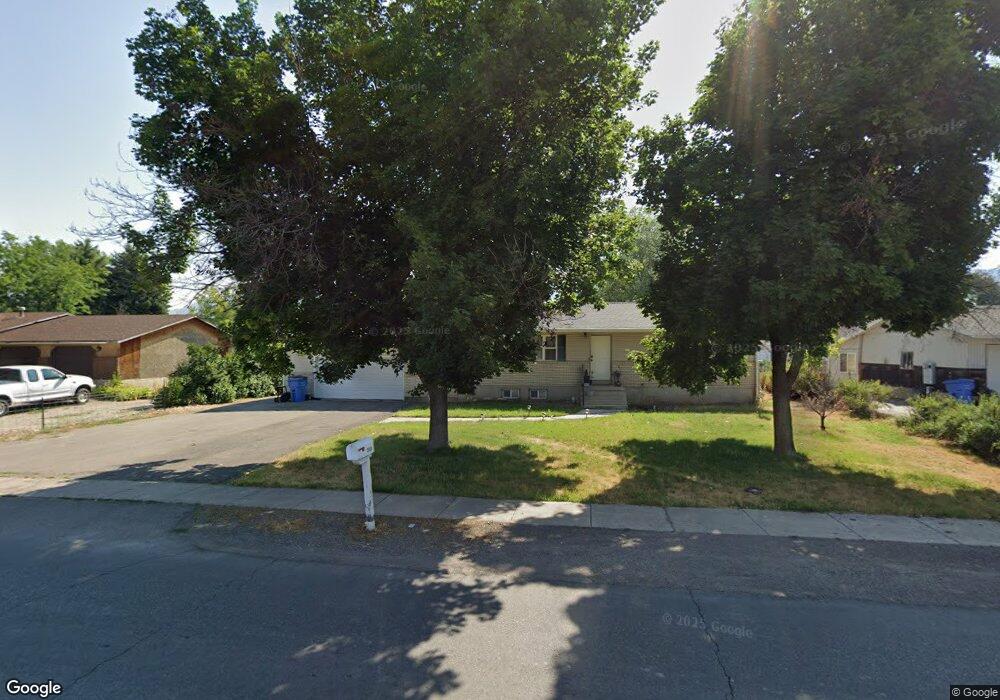
This home is located at 3130 S 800 W, Logan, UT 84321 and is currently estimated at $477,851, approximately $320 per square foot. 3130 S 800 W is a home with nearby schools including Nibley School, South Cache Middle School, and Spring Creek Middle School.
Ownership History
Date
Name
Owned For
Owner Type
Purchase Details
Closed on
Jul 26, 2017
Sold by
Barnwood Properties Lp
Bought by
Barnwood Properties Llc
Current Estimated Value
Purchase Details
Closed on
Mar 7, 2008
Sold by
Alder Scott D and Alder Cheryl L
Bought by
Gundersen Don Phillip and Gundersen Elizabeth
Home Financials for this Owner
Home Financials are based on the most recent Mortgage that was taken out on this home.
Original Mortgage
$160,000
Interest Rate
10%
Mortgage Type
Seller Take Back
Purchase Details
Closed on
Sep 1, 2006
Sold by
Alder Scott D and Alder Cheryl L
Bought by
Alder Scott D and Alder Cheryl L
Create a Home Valuation Report for This Property
The Home Valuation Report is an in-depth analysis detailing your home's value as well as a comparison with similar homes in the area
Home Values in the Area
Average Home Value in this Area
Purchase History
| Date | Buyer | Sale Price | Title Company |
|---|---|---|---|
| Barnwood Properties Llc | -- | Cache Title Company Inc | |
| Gundersen Don Phillip | -- | Northern Title Company | |
| Alder Scott D | -- | None Available |
Source: Public Records
Mortgage History
| Date | Status | Borrower | Loan Amount |
|---|---|---|---|
| Previous Owner | Gundersen Don Phillip | $160,000 |
Source: Public Records
Tax History
| Year | Tax Paid | Tax Assessment Tax Assessment Total Assessment is a certain percentage of the fair market value that is determined by local assessors to be the total taxable value of land and additions on the property. | Land | Improvement |
|---|---|---|---|---|
| 2025 | $1,724 | $228,565 | $0 | $0 |
| 2024 | $1,831 | $227,820 | $0 | $0 |
| 2023 | $1,936 | $225,605 | $0 | $0 |
| 2022 | $2,015 | $225,600 | $0 | $0 |
| 2021 | $1,935 | $336,490 | $90,850 | $245,640 |
| 2020 | $1,786 | $295,550 | $90,850 | $204,700 |
| 2019 | $1,715 | $270,650 | $90,850 | $179,800 |
| 2018 | $1,247 | $191,956 | $65,620 | $126,336 |
| 2017 | $1,203 | $98,130 | $0 | $0 |
| 2016 | $1,217 | $98,130 | $0 | $0 |
| 2015 | $1,209 | $98,130 | $0 | $0 |
| 2014 | $1,027 | $85,320 | $0 | $0 |
| 2013 | -- | $91,255 | $0 | $0 |
Source: Public Records
Map
Nearby Homes
- 860 W 2980 S
- 3350 S 960 W
- 3345 S 960 W
- 1050 W 3200 S
- 3394 S 960 W
- 732 W 2840 S Unit 7
- 712 W 2840 S Unit 9
- 702 W 2840 S Unit 10
- 722 W 2840 S Unit 8
- 2938 S 600 W
- 939 Nibley Pkwy
- 3410 S 1010 W
- 2882 S 1080 W
- 1008 W 3410 S
- 401 W 3085 S
- 3107 S 400 W
- 1336 N 1250 St E Unit 44
- 1325 N 1250 E Unit 39
- 2814 S 1100 W
- 268 W 3400 S Unit 5
Your Personal Tour Guide
Ask me questions while you tour the home.