3130 W Kemper Rd Cincinnati, OH 45251
Estimated Value: $471,000 - $569,262
4
Beds
3
Baths
2,150
Sq Ft
$247/Sq Ft
Est. Value
About This Home
This home is located at 3130 W Kemper Rd, Cincinnati, OH 45251 and is currently estimated at $530,566, approximately $246 per square foot. 3130 W Kemper Rd is a home located in Hamilton County with nearby schools including Pleasant Run Elementary School, Pleasant Run Middle School, and Northwest High School.
Ownership History
Date
Name
Owned For
Owner Type
Purchase Details
Closed on
Dec 18, 2023
Sold by
Ahr Nicole R
Bought by
Ahr Paul D
Current Estimated Value
Home Financials for this Owner
Home Financials are based on the most recent Mortgage that was taken out on this home.
Original Mortgage
$146,000
Outstanding Balance
$143,549
Interest Rate
7.44%
Mortgage Type
New Conventional
Estimated Equity
$387,017
Purchase Details
Closed on
Aug 11, 2004
Sold by
Ahr Gloria
Bought by
Ahr Paul D and Ahr Nicole R
Home Financials for this Owner
Home Financials are based on the most recent Mortgage that was taken out on this home.
Original Mortgage
$251,000
Interest Rate
6.08%
Mortgage Type
Construction
Purchase Details
Closed on
Apr 28, 2004
Sold by
Cornetet John B
Bought by
Ahr Gloria
Purchase Details
Closed on
Apr 26, 2004
Sold by
Ahr Gloria
Bought by
Cornetet John B
Purchase Details
Closed on
Jan 21, 2004
Sold by
Wurster Edward P and Wurster Sylvia
Bought by
Ahr Gloria
Create a Home Valuation Report for This Property
The Home Valuation Report is an in-depth analysis detailing your home's value as well as a comparison with similar homes in the area
Home Values in the Area
Average Home Value in this Area
Purchase History
| Date | Buyer | Sale Price | Title Company |
|---|---|---|---|
| Ahr Paul D | -- | None Listed On Document | |
| Ahr Paul D | $55,300 | Advanced Land Title Agency L | |
| Ahr Gloria | -- | -- | |
| Cornetet John B | -- | -- | |
| Ahr Gloria | $158,000 | -- |
Source: Public Records
Mortgage History
| Date | Status | Borrower | Loan Amount |
|---|---|---|---|
| Open | Ahr Paul D | $146,000 | |
| Previous Owner | Ahr Paul D | $251,000 |
Source: Public Records
Tax History Compared to Growth
Tax History
| Year | Tax Paid | Tax Assessment Tax Assessment Total Assessment is a certain percentage of the fair market value that is determined by local assessors to be the total taxable value of land and additions on the property. | Land | Improvement |
|---|---|---|---|---|
| 2024 | $9,686 | $180,177 | $36,351 | $143,826 |
| 2023 | $9,716 | $180,177 | $36,351 | $143,826 |
| 2022 | $9,040 | $136,892 | $26,362 | $110,530 |
| 2021 | $8,986 | $136,892 | $26,362 | $110,530 |
| 2020 | $9,050 | $136,892 | $26,362 | $110,530 |
| 2019 | $7,835 | $110,397 | $21,259 | $89,138 |
| 2018 | $7,030 | $110,397 | $21,259 | $89,138 |
| 2017 | $6,676 | $110,397 | $21,259 | $89,138 |
| 2016 | $6,760 | $110,618 | $26,499 | $84,119 |
| 2015 | $6,815 | $110,618 | $26,499 | $84,119 |
| 2014 | $6,828 | $110,618 | $26,499 | $84,119 |
| 2013 | $6,840 | $116,439 | $27,892 | $88,547 |
Source: Public Records
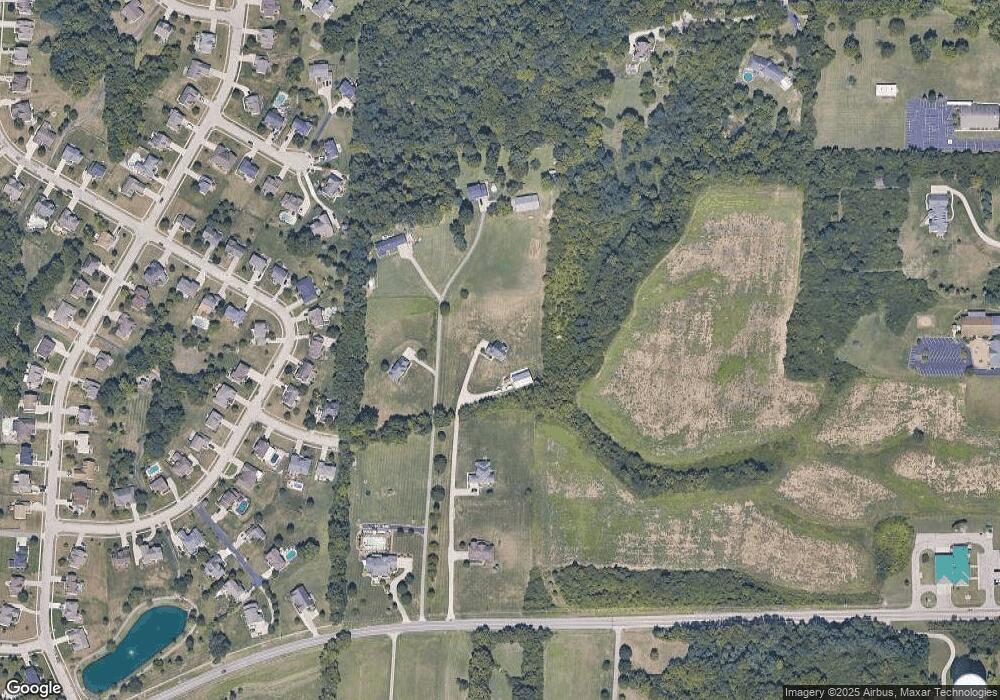
Map
Nearby Homes
- 11916 Abbeytown Dr
- 11955 Merrion Ct
- 2892 Spruceway Dr
- 3169 John Gray Rd
- 11992 Pippin Rd
- 12190 Kilbride Dr
- 2681 Haverknoll Dr
- 2605 Retford Dr
- 2617 Haverknoll Dr
- 6367 Jamesfield Ct
- 2545 Haverknoll Dr
- 125 Blair House Place
- 11888 Kittrun Ct
- 12058 Wincanton Dr
- 11586 Pippin Rd
- 27 Carousel Cir
- 12120 Regency Run Ct
- 11492 Pippin Rd
- 1605 W Augusta Blvd
- 11489 Gravenhurst Dr
- 3160 W Kemper Rd
- 3120 W Kemper Rd
- 12029 Westland Ct
- 12033 Westland Ct Unit 50
- 12025 Westland Ct
- 3150 W Kemper Rd
- 12021 Westland Ct
- 3140 W Kemper Rd
- 12045 Westland Ct
- 12014 Kilbride Dr
- 12018 Kilbride Dr
- 3206 Rothesay Ct
- 12040 Westland Ct
- 11909 Abbeytown Dr
- 11909 Abbeytown Dr Unit 66
- 12010 Kilbride Dr
- 12044 Westland Ct
- 12022 Kilbride Dr
- 11911 Abbeytown Dr Unit 65
- 12053 Westland Ct