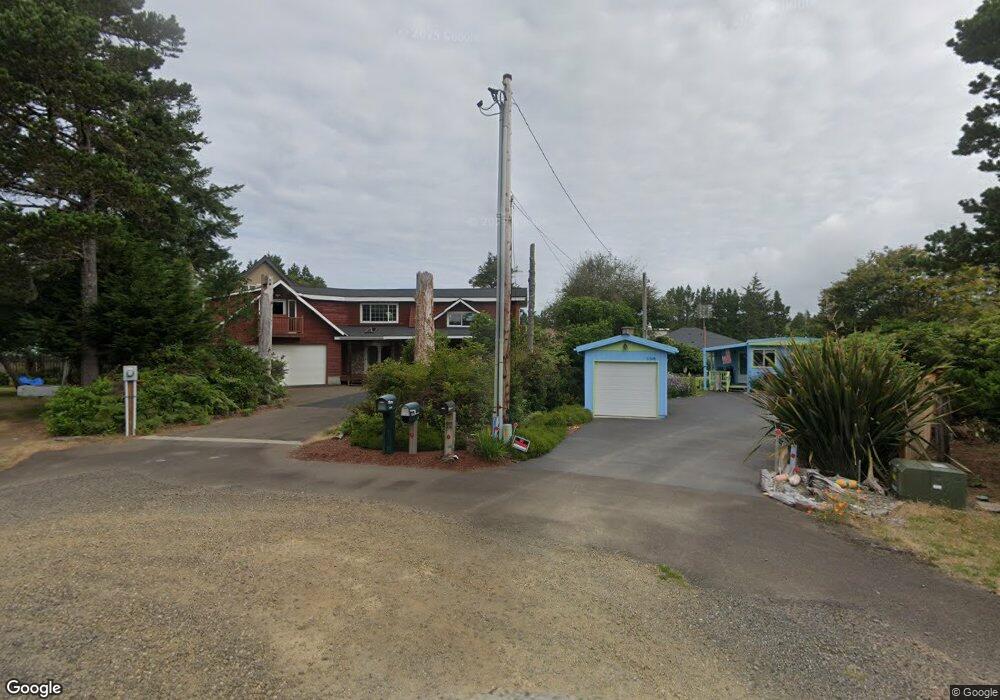
31309 M St Ocean Park, WA 98640
Estimated Value: $393,476 - $670,000
2
Beds
2
Baths
2,548
Sq Ft
$194/Sq Ft
Est. Value
About This Home
This home is located at 31309 M St, Ocean Park, WA 98640 and is currently estimated at $494,119, approximately $193 per square foot. 31309 M St is a home located in Pacific County with nearby schools including Ilwaco Senior High School.
Ownership History
Date
Name
Owned For
Owner Type
Purchase Details
Closed on
Oct 5, 2015
Sold by
Fannie Mae
Bought by
Jeffries G David and Marra Susan E
Current Estimated Value
Home Financials for this Owner
Home Financials are based on the most recent Mortgage that was taken out on this home.
Original Mortgage
$79,800
Outstanding Balance
$62,743
Interest Rate
3.86%
Mortgage Type
New Conventional
Estimated Equity
$431,376
Purchase Details
Closed on
Nov 19, 2014
Sold by
Brown Tommie and Brown Sandra
Bought by
Federal National Mortgage Association
Create a Home Valuation Report for This Property
The Home Valuation Report is an in-depth analysis detailing your home's value as well as a comparison with similar homes in the area
Home Values in the Area
Average Home Value in this Area
Purchase History
| Date | Buyer | Sale Price | Title Company |
|---|---|---|---|
| Jeffries G David | $99,750 | First American Title Co | |
| Federal National Mortgage Association | $160,303 | First American Title Co |
Source: Public Records
Mortgage History
| Date | Status | Borrower | Loan Amount |
|---|---|---|---|
| Open | Jeffries G David | $79,800 |
Source: Public Records
Tax History Compared to Growth
Tax History
| Year | Tax Paid | Tax Assessment Tax Assessment Total Assessment is a certain percentage of the fair market value that is determined by local assessors to be the total taxable value of land and additions on the property. | Land | Improvement |
|---|---|---|---|---|
| 2025 | $2,878 | $382,300 | $80,800 | $301,500 |
| 2024 | $2,878 | $402,400 | $85,000 | $317,400 |
| 2023 | $2,552 | $325,400 | $50,000 | $275,400 |
| 2022 | $2,463 | $227,800 | $35,000 | $192,800 |
| 2021 | $2,492 | $211,800 | $30,000 | $181,800 |
| 2020 | $2,449 | $191,300 | $30,000 | $161,300 |
| 2019 | $2,258 | $175,300 | $27,500 | $147,800 |
| 2018 | $2,266 | $201,700 | $30,000 | $171,700 |
| 2017 | $2,813 | $201,700 | $30,000 | $171,700 |
| 2015 | $2,314 | $179,300 | $30,000 | $149,300 |
| 2014 | -- | $164,400 | $30,000 | $134,400 |
| 2012 | -- | $196,500 | $30,000 | $166,500 |
Source: Public Records
Map
Nearby Homes