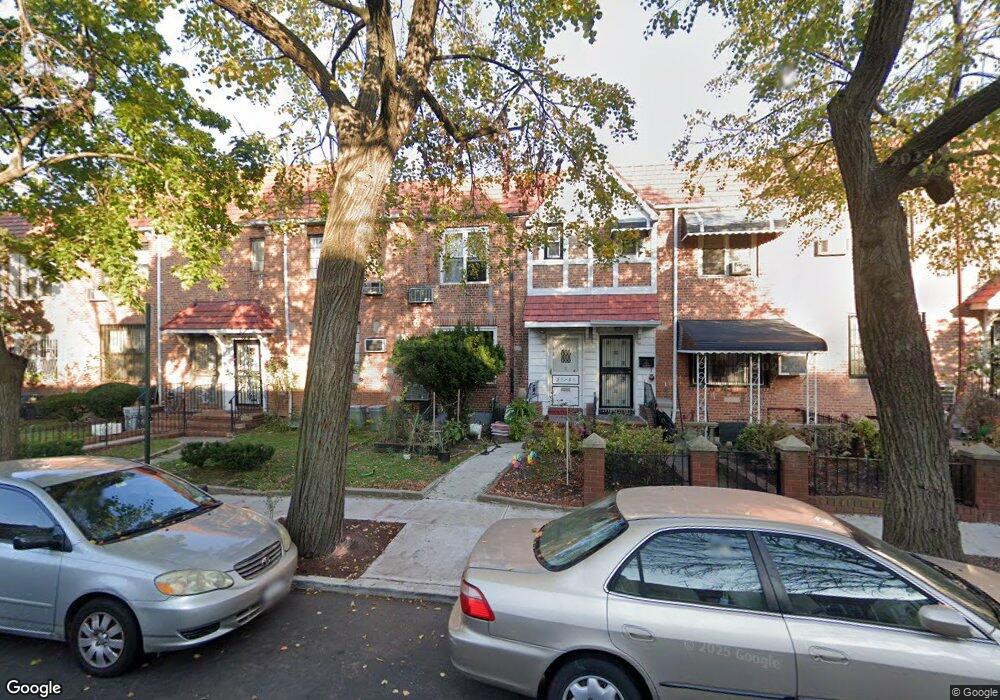
3131 76th St East Elmhurst, NY 11370
Jackson Heights NeighborhoodEstimated Value: $915,561 - $1,022,000
--
Bed
--
Bath
1,224
Sq Ft
$789/Sq Ft
Est. Value
About This Home
This home is located at 3131 76th St, East Elmhurst, NY 11370 and is currently estimated at $965,140, approximately $788 per square foot. 3131 76th St is a home located in Queens County with nearby schools including P.S. 212, I.S. 230, and William Cullen Bryant High School.
Ownership History
Date
Name
Owned For
Owner Type
Purchase Details
Closed on
Nov 18, 2024
Sold by
Choy Mary and Yu Eric H
Bought by
Em2e Llc
Current Estimated Value
Purchase Details
Closed on
Oct 4, 2018
Sold by
Escaler Eilly and Yu Eilly
Bought by
Choy Mary and Yu Eric Ho
Purchase Details
Closed on
Dec 23, 2003
Sold by
Yu Lai Kiu
Bought by
Escaler and Eilly
Home Financials for this Owner
Home Financials are based on the most recent Mortgage that was taken out on this home.
Original Mortgage
$153,000
Interest Rate
5.67%
Mortgage Type
Purchase Money Mortgage
Purchase Details
Closed on
Jan 18, 1996
Sold by
Prevete John
Bought by
Yu Lai Kiu
Home Financials for this Owner
Home Financials are based on the most recent Mortgage that was taken out on this home.
Original Mortgage
$120,000
Interest Rate
7.04%
Create a Home Valuation Report for This Property
The Home Valuation Report is an in-depth analysis detailing your home's value as well as a comparison with similar homes in the area
Home Values in the Area
Average Home Value in this Area
Purchase History
| Date | Buyer | Sale Price | Title Company |
|---|---|---|---|
| Em2e Llc | -- | -- | |
| Choy Mary | -- | -- | |
| Choy Mary | -- | -- | |
| Escaler | $170,000 | -- | |
| Escaler | $170,000 | -- | |
| Yu Lai Kiu | $173,500 | -- | |
| Yu Lai Kiu | $173,500 | -- |
Source: Public Records
Mortgage History
| Date | Status | Borrower | Loan Amount |
|---|---|---|---|
| Previous Owner | Escaler | $153,000 | |
| Previous Owner | Yu Lai Kiu | $120,000 |
Source: Public Records
Tax History Compared to Growth
Tax History
| Year | Tax Paid | Tax Assessment Tax Assessment Total Assessment is a certain percentage of the fair market value that is determined by local assessors to be the total taxable value of land and additions on the property. | Land | Improvement |
|---|---|---|---|---|
| 2025 | $8,276 | $43,675 | $7,028 | $36,647 |
| 2024 | $8,276 | $41,206 | $7,379 | $33,827 |
| 2023 | $7,916 | $39,413 | $6,225 | $33,188 |
| 2022 | $7,810 | $49,500 | $9,240 | $40,260 |
| 2021 | $8,119 | $50,340 | $9,240 | $41,100 |
| 2020 | $7,704 | $43,500 | $9,240 | $34,260 |
| 2019 | $7,183 | $40,860 | $9,240 | $31,620 |
| 2018 | $6,695 | $32,844 | $7,915 | $24,929 |
| 2017 | $6,646 | $32,602 | $7,619 | $24,983 |
| 2016 | $6,427 | $32,602 | $7,619 | $24,983 |
| 2015 | $3,490 | $30,330 | $9,051 | $21,279 |
| 2014 | $3,490 | $28,615 | $8,801 | $19,814 |
Source: Public Records
Map
Nearby Homes