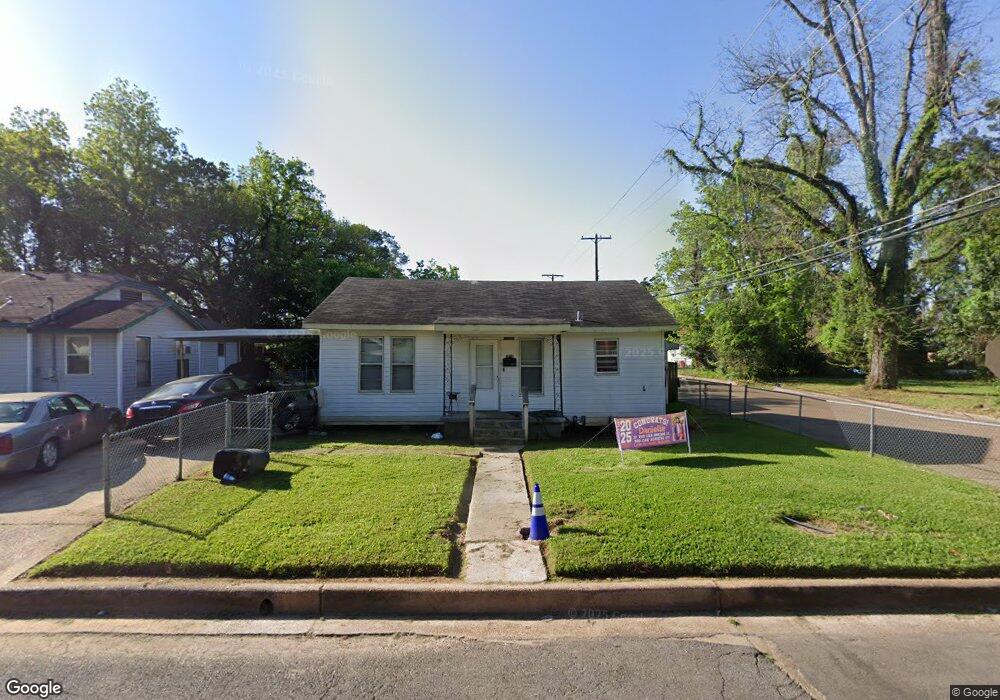
3131 Levin St Alexandria, LA 71301
Estimated Value: $32,000 - $55,363
3
Beds
1
Bath
1,056
Sq Ft
$42/Sq Ft
Est. Value
About This Home
This home is located at 3131 Levin St, Alexandria, LA 71301 and is currently estimated at $44,841, approximately $42 per square foot. 3131 Levin St is a home with nearby schools including D.F. Huddle Elementary School, Alexandria Middle Magnet School, and Bolton High School.
Ownership History
Date
Name
Owned For
Owner Type
Purchase Details
Closed on
Jul 10, 2019
Sold by
The Evangeline Bank & Trust Company
Bought by
Approioated Properties Llc
Current Estimated Value
Purchase Details
Closed on
Jun 13, 2018
Sold by
Rapides Parish Sheriff
Bought by
Evangeline Bank & Tr Co
Purchase Details
Closed on
Oct 20, 2014
Sold by
Holsom Enterprises Llc
Bought by
Smith Andy J
Home Financials for this Owner
Home Financials are based on the most recent Mortgage that was taken out on this home.
Original Mortgage
$23,250
Interest Rate
4.25%
Mortgage Type
New Conventional
Purchase Details
Closed on
Mar 20, 2008
Sold by
Gremillion Renee D
Bought by
Holsom Enterprises L L C
Home Financials for this Owner
Home Financials are based on the most recent Mortgage that was taken out on this home.
Original Mortgage
$31,950
Interest Rate
6.11%
Mortgage Type
Credit Line Revolving
Create a Home Valuation Report for This Property
The Home Valuation Report is an in-depth analysis detailing your home's value as well as a comparison with similar homes in the area
Purchase History
| Date | Buyer | Sale Price | Title Company |
|---|---|---|---|
| Approioated Properties Llc | $19,040 | None Available | |
| Evangeline Bank & Tr Co | $12,334 | None Available | |
| Smith Andy J | $31,000 | -- | |
| Holsom Enterprises L L C | $25,000 | None Available |
Source: Public Records
Mortgage History
| Date | Status | Borrower | Loan Amount |
|---|---|---|---|
| Previous Owner | Smith Andy J | $23,250 | |
| Previous Owner | Holsom Enterprises L L C | $31,950 |
Source: Public Records
Tax History
| Year | Tax Paid | Tax Assessment Tax Assessment Total Assessment is a certain percentage of the fair market value that is determined by local assessors to be the total taxable value of land and additions on the property. | Land | Improvement |
|---|---|---|---|---|
| 2024 | $156 | $1,700 | $300 | $1,400 |
| 2023 | $157 | $1,700 | $300 | $1,400 |
| 2022 | $201 | $1,700 | $300 | $1,400 |
| 2021 | $173 | $1,700 | $300 | $1,400 |
| 2020 | $173 | $1,700 | $300 | $1,400 |
| 2019 | $239 | $3,100 | $300 | $2,800 |
| 2018 | $0 | $3,100 | $308 | $2,792 |
| 2017 | $0 | $3,100 | $308 | $2,792 |
| 2016 | $344 | $3,100 | $308 | $2,792 |
| 2015 | $343 | $3,100 | $308 | $2,792 |
| 2014 | $278 | $2,500 | $308 | $2,192 |
| 2013 | $266 | $2,500 | $308 | $2,192 |
Source: Public Records
Map
Nearby Homes
- 31 Texas Ave
- 61 Meyer St
- 2813 Hynson St
- 1 Macarthur Dr
- 54 David St
- 200 Mary Ln
- 59 Westwood Blvd
- 90 Essie St
- 3017 Bayou Fields Dr
- 3023 Bayou Fields Dr
- 2422 Paris St
- 3216 Madonna Dr
- 3312 Levin St
- 202 Sweetbriar Dr
- 37 Chester St
- 2214 Alma St
- 302 Sweetbriar Dr
- 2710 Elliott St
- 3 Traditions None
- 18 Traditions None