Estimated Value: $217,722 - $246,000
--
Bed
2
Baths
1,618
Sq Ft
$144/Sq Ft
Est. Value
About This Home
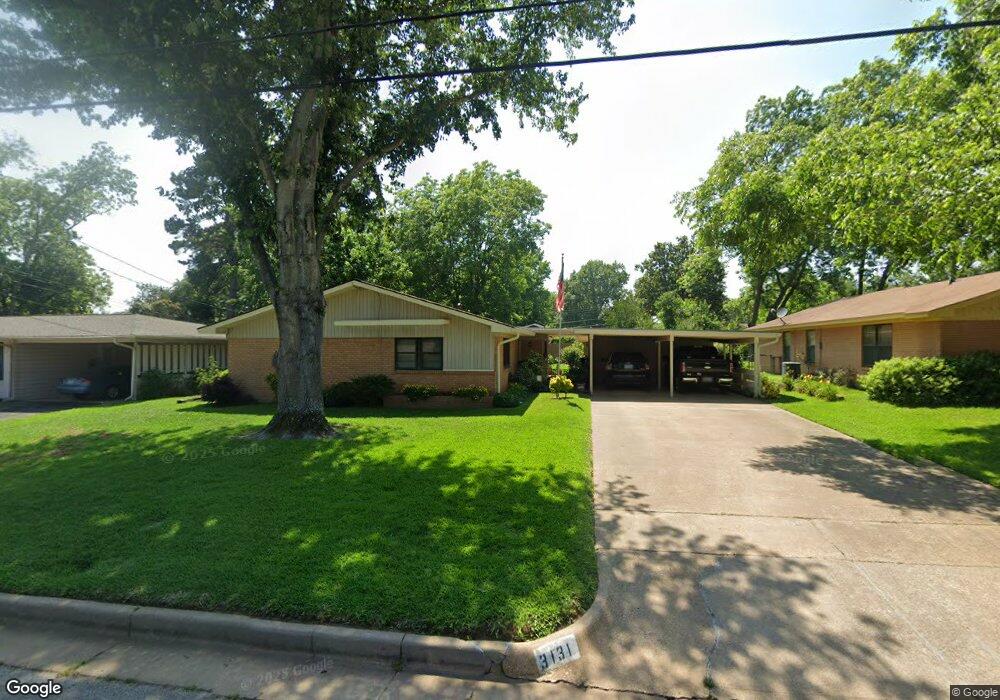
This home is located at 3131 S Donnybrook Ave, Tyler, TX 75701 and is currently estimated at $232,431, approximately $143 per square foot. 3131 S Donnybrook Ave is a home located in Smith County with nearby schools including Woods Elementary School, Hubbard Middle School, and Tyler Legacy High School.
Ownership History
Date
Name
Owned For
Owner Type
Purchase Details
Closed on
Sep 27, 2006
Sold by
Gilley Nora Lisa
Bought by
Gilley Tom W and Standifer Derene Ann
Current Estimated Value
Create a Home Valuation Report for This Property
The Home Valuation Report is an in-depth analysis detailing your home's value as well as a comparison with similar homes in the area
Home Values in the Area
Average Home Value in this Area
Purchase History
| Date | Buyer | Sale Price | Title Company |
|---|---|---|---|
| Gilley Tom W | -- | None Available | |
| Gilley Tom W | -- | None Available |
Source: Public Records
Tax History Compared to Growth
Tax History
| Year | Tax Paid | Tax Assessment Tax Assessment Total Assessment is a certain percentage of the fair market value that is determined by local assessors to be the total taxable value of land and additions on the property. | Land | Improvement |
|---|---|---|---|---|
| 2025 | $533 | $224,318 | $35,550 | $188,768 |
| 2024 | $533 | $184,653 | $35,104 | $191,159 |
| 2023 | $2,926 | $212,643 | $35,104 | $177,539 |
| 2022 | $2,990 | $153,839 | $25,616 | $128,223 |
| 2021 | $2,911 | $138,732 | $25,616 | $113,116 |
| 2020 | $2,886 | $134,859 | $25,616 | $109,243 |
| 2019 | $2,860 | $130,803 | $18,975 | $111,828 |
| 2018 | $2,814 | $129,402 | $18,975 | $110,427 |
| 2017 | $2,603 | $121,941 | $18,975 | $102,966 |
| 2016 | $2,402 | $112,512 | $18,975 | $93,537 |
| 2015 | $1,636 | $108,446 | $18,975 | $89,471 |
| 2014 | $1,636 | $105,193 | $18,975 | $86,218 |
Source: Public Records
Map
Nearby Homes
- 3202 S Donnybrook Ave
- 3210 S Donnybrook Ave
- 315 Ridgecrest Dr
- 121 Fair Ln
- 611 E Watkins St
- 2835 S Broadway Ave
- 317 Amberwood Cir
- 3300 Old Bullard Rd
- 403 Beechwood Dr
- 3308 Greenoak Place
- 2736 Old Bullard Rd
- 3511 S Keaton Ave
- 905 E Watkins St
- 309 Glenhaven Dr
- 1018 Pollard Dr
- 3712 Colony Park Dr
- 505 Buckingham Place
- 509 Buckingham Place
- 2917 Sunnybrook Dr
- 904 E Dulse St
- 3125 3125 S Donnybrook
- 3125 S Donnybrook Ave
- 3137 S Donnybrook Ave
- 3132 Colgate Ave
- 3143 S Donnybrook Ave
- 3121 S Donnybrook Ave
- 3143 3143 Donnybrook Ave
- 3121 3121 Donnybrook
- 3126 Colgate Ave
- 3136 3136 S Donnybrook
- 3128 S Donnybrook Ave
- 3120 Colgate Ave
- 3144 Colgate Ave
- 3124 S Donnybrook Ave
- 3136 S Donnybrook Ave
- 3144 3144 Colgate Ave
- 3201 S Donnybrook Ave
- 3115 S Donnybrook Ave
- 3142 3142 S Donnybrook
- 3201 3201 Donnybrook