Estimated Value: $264,000 - $746,640
3
Beds
3
Baths
2,268
Sq Ft
$223/Sq Ft
Est. Value
About This Home
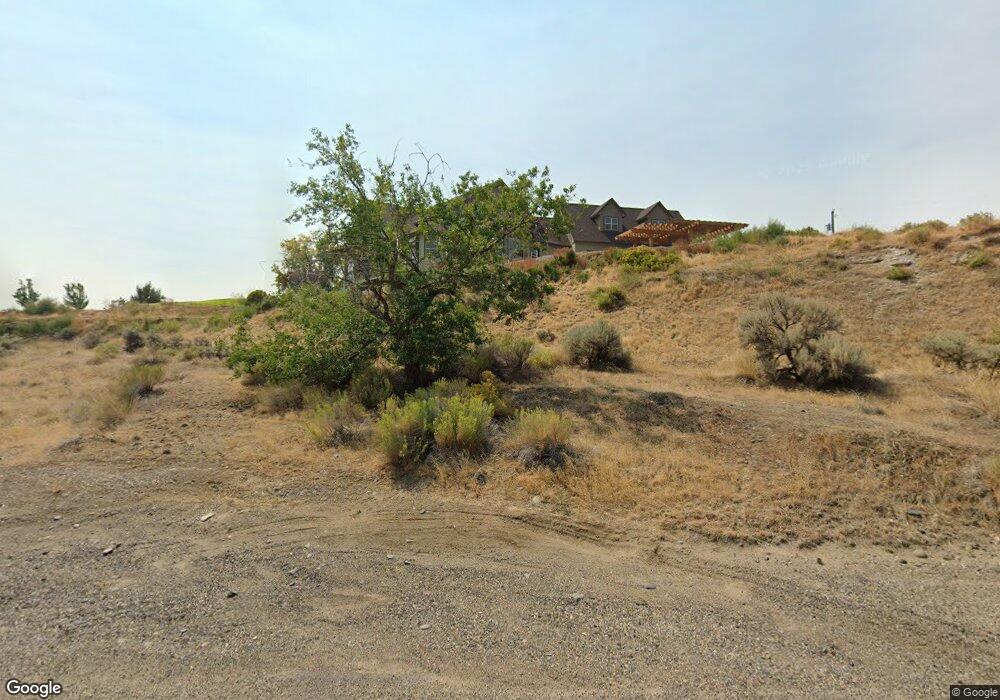
This home is located at 3131 Shay Way, Nyssa, OR 97913 and is currently estimated at $505,320, approximately $222 per square foot. 3131 Shay Way is a home located in Malheur County with nearby schools including Nyssa Elementary School, Nyssa Middle School, and Nyssa High School.
Create a Home Valuation Report for This Property
The Home Valuation Report is an in-depth analysis detailing your home's value as well as a comparison with similar homes in the area
Tax History
| Year | Tax Paid | Tax Assessment Tax Assessment Total Assessment is a certain percentage of the fair market value that is determined by local assessors to be the total taxable value of land and additions on the property. | Land | Improvement |
|---|---|---|---|---|
| 2025 | $5,485 | $380,179 | $36,592 | $343,587 |
| 2024 | $5,401 | $369,106 | $40,908 | $328,198 |
| 2023 | $5,311 | $358,356 | $35,969 | $322,387 |
| 2022 | $5,309 | $347,919 | $37,561 | $310,358 |
| 2021 | $5,248 | $337,786 | $31,726 | $306,060 |
| 2020 | $5,142 | $327,948 | $34,659 | $293,289 |
| 2019 | $5,036 | $318,397 | $41,551 | $276,846 |
| 2018 | $4,894 | $309,124 | $40,341 | $268,783 |
| 2017 | $4,548 | $300,121 | $39,843 | $260,278 |
| 2016 | $4,600 | $291,380 | $34,245 | $257,135 |
| 2015 | $4,000 | $282,894 | $33,481 | $249,413 |
| 2014 | $4,311 | $273,380 | $40,810 | $232,570 |
Source: Public Records
Map
Nearby Homes
- 3091 Echo Rd
- lot2 plat 2411 Oregon 201
- 904 Oak St Unit 44
- 710 Emison Ave
- 617 Park Ave
- 813 Reece Ave
- 404 N 3rd St
- 705 N 2nd St
- 416 N 2nd St
- 1770 N 3rd St
- 106 E Main St
- 110 E Main St
- 108 E Main St
- 112 E Main St
- TBD Sunset View Road (Lot 5)
- 0 Leigh Ln
- 28750 Rocky Rd
- TBD Ada Ln
- 28650 Rocky Rd
- 31854 Apple Valley Rd
Your Personal Tour Guide
Ask me questions while you tour the home.