Estimated Value: $201,491 - $253,000
3
Beds
2
Baths
2,264
Sq Ft
$100/Sq Ft
Est. Value
About This Home
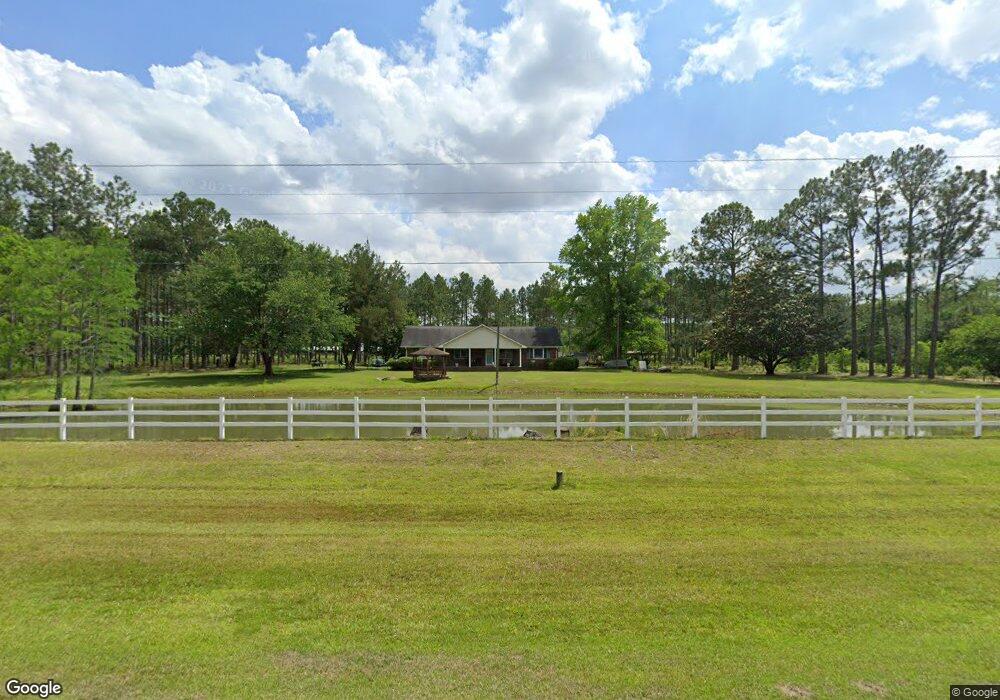
This home is located at 3132 Ga Highway 32 W, Chula, GA 31733 and is currently estimated at $225,623, approximately $99 per square foot. 3132 Ga Highway 32 W is a home located in Irwin County with nearby schools including Irwin County Elementary School, Irwin County Middle School, and Irwin County High School.
Ownership History
Date
Name
Owned For
Owner Type
Purchase Details
Closed on
Jul 17, 2019
Sold by
Howard Dottie Marie
Bought by
Mcduffie Joseph G
Current Estimated Value
Home Financials for this Owner
Home Financials are based on the most recent Mortgage that was taken out on this home.
Original Mortgage
$123,232
Outstanding Balance
$107,918
Interest Rate
3.8%
Mortgage Type
New Conventional
Estimated Equity
$117,705
Purchase Details
Closed on
Jan 23, 2015
Sold by
Butler Teresa Darlene J
Bought by
Howard James E and Howard Dottie M
Purchase Details
Closed on
May 1, 2011
Sold by
Howard James E
Bought by
Butler Teresa Darlene J and Howard Darne E
Purchase Details
Closed on
Jul 18, 1997
Sold by
Owens Bert R
Bought by
Howard James E
Purchase Details
Closed on
Dec 1, 1995
Sold by
Cone Michael
Bought by
Owens Bert R
Purchase Details
Closed on
Mar 24, 1994
Bought by
Cone Michael
Create a Home Valuation Report for This Property
The Home Valuation Report is an in-depth analysis detailing your home's value as well as a comparison with similar homes in the area
Home Values in the Area
Average Home Value in this Area
Purchase History
| Date | Buyer | Sale Price | Title Company |
|---|---|---|---|
| Mcduffie Joseph G | $122,000 | -- | |
| Howard James E | -- | -- | |
| Butler Teresa Darlene J | -- | -- | |
| Howard James E | $82,500 | -- | |
| Owens Bert R | $70,000 | -- | |
| Cone Michael | $62,500 | -- |
Source: Public Records
Mortgage History
| Date | Status | Borrower | Loan Amount |
|---|---|---|---|
| Open | Mcduffie Joseph G | $123,232 |
Source: Public Records
Tax History Compared to Growth
Tax History
| Year | Tax Paid | Tax Assessment Tax Assessment Total Assessment is a certain percentage of the fair market value that is determined by local assessors to be the total taxable value of land and additions on the property. | Land | Improvement |
|---|---|---|---|---|
| 2024 | $1,353 | $42,952 | $2,536 | $40,416 |
| 2023 | $1,353 | $42,952 | $2,536 | $40,416 |
| 2022 | $1,353 | $42,952 | $2,536 | $40,416 |
| 2021 | $1,353 | $42,952 | $2,536 | $40,416 |
| 2020 | $1,353 | $42,952 | $2,536 | $40,416 |
| 2019 | $1,290 | $42,952 | $2,536 | $40,416 |
| 2018 | $1,234 | $42,952 | $2,536 | $40,416 |
| 2017 | $1,235 | $43,000 | $2,536 | $40,464 |
| 2016 | $1,190 | $43,000 | $2,536 | $40,464 |
| 2015 | -- | $43,000 | $2,536 | $40,464 |
| 2014 | -- | $43,000 | $2,536 | $40,464 |
| 2013 | -- | $43,000 | $2,536 | $40,464 |
Source: Public Records
Map
Nearby Homes
- 0 Wyatt Way
- 5701 Ga Highway 32 E
- 5106 Georgia 125
- 746 Chula Brookfield Rd
- 18 Hank Mike Rd
- 64 Hank Mike Rd
- 357 Chula Brookfield Rd
- 257 Adams Rd
- 1576 Chula Brookfield Rd
- n/a Wiley Branch Rd
- 7 Red Oak Rd
- 0 Hall Mixon Rd Unit 138661
- 0 Hall Mixon Rd Unit 10576562
- 0 Warren St
- 0 Clements-Simmons Rd
- 100 Long Pine Rd
- 5704 Forest Lake Dr W
- 1024 Ten Mile Rd
- 0 Brighton Rd
- Lot 222 Forest Lakes Dr
- 3134 Ga Highway 32 W
- 3065 Ga Highway 32 W
- 3064 Ga Highway 32 W
- 3196 Ga Highway 32 W
- 3231 Ga Highway 32 W
- 1139 Sycamore Hwy
- 678 Waterloo Rebecca Hwy
- 787 Waterloo Rebecca Hwy
- 611 Waterloo Rebecca Hwy
- 811 Waterloo Rebecca Hwy
- 2921 Ga Highway 32 W
- 831 Waterloo Rebecca Hwy
- 831 Waterloo Rebecca Hwy
- 573 Waterloo Rebecca Hwy
- 436 Eureka Church Rd
- 2926 Ga Highway 32 W
- 578 Waterloo Rebecca Hwy
- 197 Ohoopee Ln
- 850 Waterloo Rebecca Hwy
- 152 Ohoopee Ln