3132 Windchase Blvd Unit 435 Houston, TX 77082
Briar Village NeighborhoodEstimated Value: $174,000 - $193,000
2
Beds
3
Baths
1,358
Sq Ft
$134/Sq Ft
Est. Value
About This Home
This home is located at 3132 Windchase Blvd Unit 435, Houston, TX 77082 and is currently estimated at $182,118, approximately $134 per square foot. 3132 Windchase Blvd Unit 435 is a home located in Harris County with nearby schools including Heflin Elementary School, Budewig Intermediate School, and O'Donnell Middle School.
Ownership History
Date
Name
Owned For
Owner Type
Purchase Details
Closed on
Aug 2, 2023
Sold by
King Wc8
Bought by
Allison Leslie
Current Estimated Value
Purchase Details
Closed on
Oct 5, 2022
Sold by
Allison Leslie
Bought by
Wc8 King A Texas Company Llc
Purchase Details
Closed on
Mar 27, 2020
Sold by
Equity Trust Company
Bought by
Allison Leslie
Purchase Details
Closed on
Apr 11, 2013
Sold by
Warfield Ronald E and Cookson Helen J
Bought by
Equity Trust Co and Michael Haynes Ira
Purchase Details
Closed on
May 10, 2004
Sold by
Cookson Helen J and Warfield Helen C
Bought by
Warfield Ronald E and Warfield Helen C
Purchase Details
Closed on
Mar 29, 1995
Sold by
Mackenna Michael J and Wenny Carole L
Bought by
Cookson Helen J
Home Financials for this Owner
Home Financials are based on the most recent Mortgage that was taken out on this home.
Original Mortgage
$41,850
Interest Rate
8.72%
Create a Home Valuation Report for This Property
The Home Valuation Report is an in-depth analysis detailing your home's value as well as a comparison with similar homes in the area
Home Values in the Area
Average Home Value in this Area
Purchase History
| Date | Buyer | Sale Price | Title Company |
|---|---|---|---|
| Allison Leslie | -- | None Listed On Document | |
| Wc8 King A Texas Company Llc | -- | -- | |
| Allison Leslie | -- | None Available | |
| Equity Trust Co | -- | First American Title | |
| Warfield Ronald E | -- | -- | |
| Cookson Helen J | -- | Regency Title |
Source: Public Records
Mortgage History
| Date | Status | Borrower | Loan Amount |
|---|---|---|---|
| Previous Owner | Cookson Helen J | $41,850 |
Source: Public Records
Tax History Compared to Growth
Tax History
| Year | Tax Paid | Tax Assessment Tax Assessment Total Assessment is a certain percentage of the fair market value that is determined by local assessors to be the total taxable value of land and additions on the property. | Land | Improvement |
|---|---|---|---|---|
| 2025 | $3,229 | $166,891 | $31,758 | $135,133 |
| 2024 | $3,229 | $158,762 | $31,758 | $127,004 |
| 2023 | $3,229 | $184,359 | $31,758 | $152,601 |
| 2022 | $3,354 | $160,223 | $21,701 | $138,522 |
| 2021 | $2,505 | $113,500 | $21,701 | $91,799 |
| 2020 | $2,953 | $127,778 | $21,701 | $106,077 |
| 2019 | $2,926 | $122,781 | $17,467 | $105,314 |
| 2018 | $0 | $114,990 | $16,302 | $98,688 |
| 2017 | $2,775 | $114,990 | $16,302 | $98,688 |
| 2016 | $2,610 | $108,141 | $16,302 | $91,839 |
| 2015 | $2,046 | $90,080 | $16,302 | $73,778 |
| 2014 | $2,046 | $76,885 | $16,302 | $60,583 |
Source: Public Records
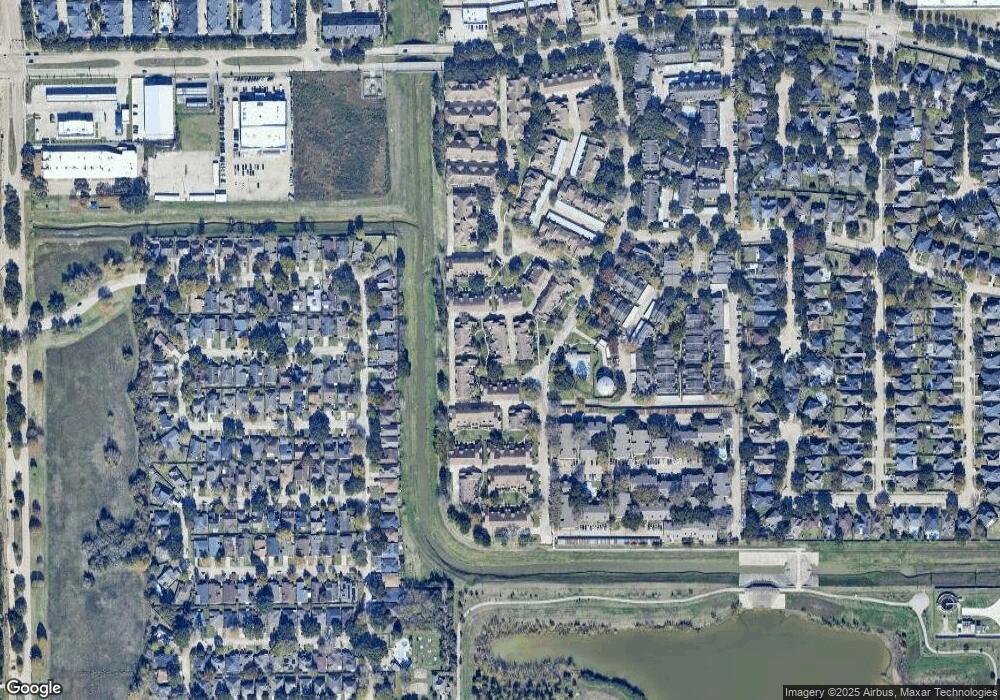
Map
Nearby Homes
- 3148 Windchase Blvd Unit 442
- 3162 Windchase Blvd Unit 451
- 3224 Windchase Blvd Unit 495
- 3206 Windchase Blvd Unit 471
- 13806 Sheri Hollow Ln
- 3143 Windchase Blvd Unit 785
- 3065 Windchase Blvd Unit 719
- 13807 Beech Hollow Ln
- 13461 Garden Grove Unit 761
- 13483 Garden Grove Unit 723
- 2948 Meadowgrass Ln Unit 175
- 13351 Arlon Trail
- 2895 Panagard Dr Unit 4209
- 2889 Panagard Dr Unit 42
- 2865 Westhollow Dr Unit 83
- 2865 Westhollow Dr Unit 61
- 3143 W Hampton Dr
- 2831 Panagard Dr Unit 39
- 13833 Hollowgreen Dr
- 13835 Hollowgreen Dr
- 3130 Windchase Blvd Unit 436
- 3134 Windchase Blvd Unit 434
- 3120 Windchase Blvd Unit 424
- 3136 Windchase Blvd Unit 433
- 3124 Windchase Blvd Unit 422
- 3122 Windchase Blvd Unit 423
- 3126 Windchase Blvd Unit 421
- 3124 Windchase Blvd
- 3128 Windchase Blvd Unit 437
- 3138 Windchase Blvd Unit 432
- 3118 Windchase Blvd Unit 425
- 3146 Windchase Blvd Unit 443
- 3152 Windchase Blvd Unit 456
- 3116 Windchase Blvd Unit 426
- 3144 Windchase Blvd Unit 444
- 3154 Windchase Blvd Unit 455
- 3140 Windchase Blvd Unit 431
- 3142 Windchase Blvd Unit 445
- 3168 Windchase Blvd Unit 464
- 3170 Windchase Blvd Unit 463