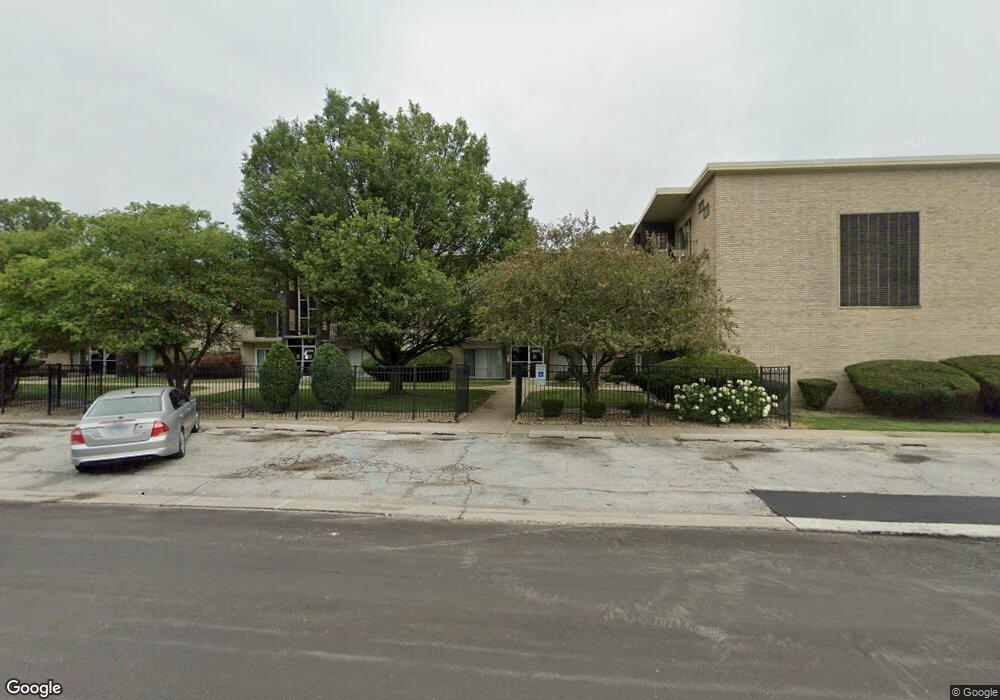
Bernice Terraces 3133 Bernice Rd Lansing, IL 60438
Estimated Value: $60,000 - $74,000
1
Bed
1
Bath
750
Sq Ft
$88/Sq Ft
Est. Value
About This Home
This home is located at 3133 Bernice Rd, Lansing, IL 60438 and is currently estimated at $66,358, approximately $88 per square foot. 3133 Bernice Rd is a home located in Cook County with nearby schools including Reavis Elementary School, Memorial Jr High School, and Thornton Fractnl So High School.
Ownership History
Date
Name
Owned For
Owner Type
Purchase Details
Closed on
Aug 16, 2022
Sold by
Alfio John Bottari Revocable Trust
Bought by
Alfio John Bottari And Michelle S Bottari Liv
Current Estimated Value
Purchase Details
Closed on
Sep 3, 2019
Sold by
Bottari John A and Bottari Michelle S
Bought by
Bottari John A and Alfio John Bottari Revocable Trust
Purchase Details
Closed on
May 22, 2006
Sold by
White Debra A and Rogers Debra A
Bought by
Bottari John A and Bottari Michelle S
Home Financials for this Owner
Home Financials are based on the most recent Mortgage that was taken out on this home.
Original Mortgage
$38,800
Interest Rate
6.62%
Mortgage Type
Fannie Mae Freddie Mac
Purchase Details
Closed on
Dec 1, 1998
Sold by
Ncc Bernice Terraces Llc
Bought by
White Debra A
Home Financials for this Owner
Home Financials are based on the most recent Mortgage that was taken out on this home.
Original Mortgage
$46,560
Interest Rate
6.93%
Create a Home Valuation Report for This Property
The Home Valuation Report is an in-depth analysis detailing your home's value as well as a comparison with similar homes in the area
Home Values in the Area
Average Home Value in this Area
Purchase History
| Date | Buyer | Sale Price | Title Company |
|---|---|---|---|
| Alfio John Bottari And Michelle S Bottari Liv | -- | None Listed On Document | |
| Bottari John A | -- | Attorney | |
| Bottari John A | $48,500 | Atgf Inc | |
| White Debra A | $48,000 | -- |
Source: Public Records
Mortgage History
| Date | Status | Borrower | Loan Amount |
|---|---|---|---|
| Previous Owner | Bottari John A | $38,800 | |
| Previous Owner | White Debra A | $46,560 |
Source: Public Records
Tax History Compared to Growth
Tax History
| Year | Tax Paid | Tax Assessment Tax Assessment Total Assessment is a certain percentage of the fair market value that is determined by local assessors to be the total taxable value of land and additions on the property. | Land | Improvement |
|---|---|---|---|---|
| 2024 | $2,372 | $4,904 | $349 | $4,555 |
| 2023 | $1,700 | $4,904 | $349 | $4,555 |
| 2022 | $1,700 | $2,617 | $480 | $2,137 |
| 2021 | $1,654 | $2,616 | $479 | $2,137 |
| 2020 | $1,535 | $2,616 | $479 | $2,137 |
| 2019 | $1,904 | $3,345 | $435 | $2,910 |
| 2018 | $1,869 | $3,345 | $435 | $2,910 |
| 2017 | $1,887 | $3,345 | $435 | $2,910 |
| 2016 | $2,570 | $4,700 | $392 | $4,308 |
| 2015 | $2,388 | $4,700 | $392 | $4,308 |
| 2014 | $2,355 | $4,700 | $392 | $4,308 |
| 2013 | $1,570 | $3,488 | $392 | $3,096 |
Source: Public Records
About Bernice Terraces
Map
Nearby Homes
- 3026 Bernice Rd Unit 308
- 17318 Walter St
- 3253 Bernice Rd
- 3425 Bernice Ave
- 17256 Walter St
- 17303 Chicago Ave
- 17518 Roy St
- 2950 Bernice Rd
- 17317 Roy St
- 17303 Roy St
- 17552 Roy St
- 17335 Community St
- 17218 Park Ave
- 17331 Community St
- 3347 Bernice Rd
- 17519 Community St
- 17226 Community St
- 17157 Walter St
- 17153 Walter St
- 17641 Burnham Ave
- 3133 Bernice Rd Unit 31332
- 3133 Bernice Rd Unit 31333
- 3133 Bernice Rd Unit 31334
- 3133 Bernice Rd Unit 31336
- 3133 Bernice Rd Unit 4
- 3133 Bernice Rd Unit 1
- 3133 Bernice Rd Unit 5
- 3133 Bernice Rd Unit 2
- 3133 Bernice Rd Unit 6
- 3133 Bernice Rd Unit 3
- 3127 Bernice Rd Unit 31272
- 3127 Bernice Rd Unit 31274
- 3127 Bernice Rd Unit 31271
- 3127 Bernice Rd Unit 31276
- 3127 Bernice Rd Unit 31273
- 3127 Bernice Rd Unit 5
- 3127 Bernice Rd Unit 1
- 3127 Bernice Rd Unit 4
- 3145 Bernice Rd Unit 31456
- 3145 Bernice Rd Unit 31454