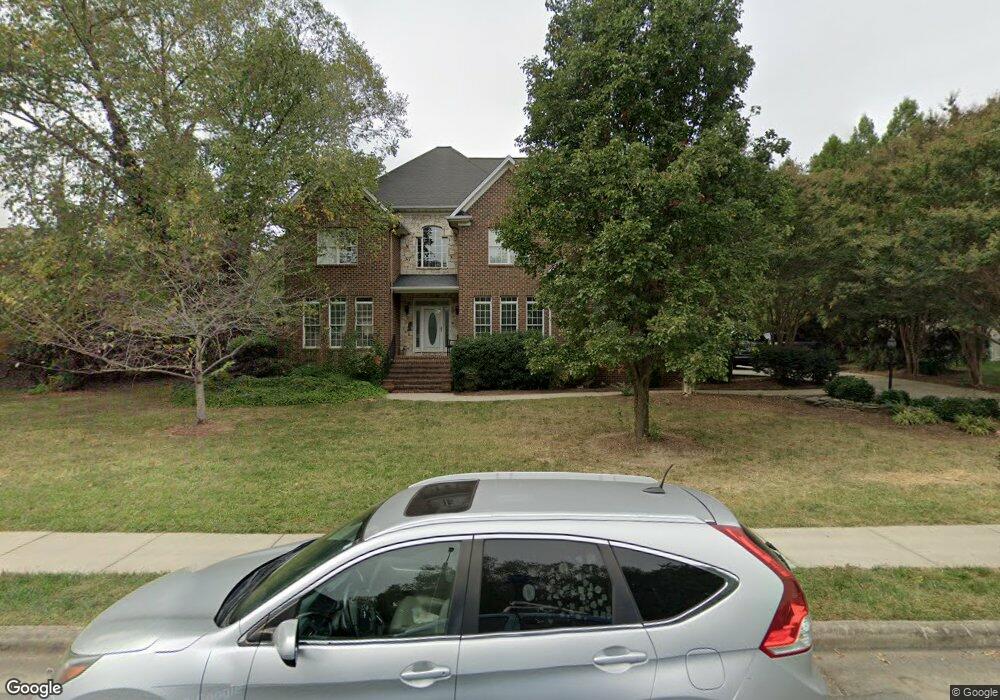
3133 Brycewood Place Burlington, NC 27215
West Burlington NeighborhoodEstimated Value: $761,000 - $836,000
5
Beds
6
Baths
4,606
Sq Ft
$172/Sq Ft
Est. Value
About This Home
This home is located at 3133 Brycewood Place, Burlington, NC 27215 and is currently estimated at $791,231, approximately $171 per square foot. 3133 Brycewood Place is a home located in Alamance County with nearby schools including Marvin B. Smith Elementary School, Turrentine Middle School, and Walter M. Williams High School.
Ownership History
Date
Name
Owned For
Owner Type
Purchase Details
Closed on
Oct 31, 2024
Sold by
Vatter Michael Robert and Vatter Melanie Barber
Bought by
Freeman Revocable Trust and Vatter
Current Estimated Value
Purchase Details
Closed on
Aug 7, 2018
Sold by
Prof-2013-S3 Legal Title Trust Iv
Bought by
Vatter Michael Robert
Home Financials for this Owner
Home Financials are based on the most recent Mortgage that was taken out on this home.
Original Mortgage
$324,140
Interest Rate
4.5%
Purchase Details
Closed on
Jun 27, 2018
Sold by
Crean Carolyn and Sproule Patricia Gail
Bought by
Crean Carolyn D and Sproule Patricia G
Home Financials for this Owner
Home Financials are based on the most recent Mortgage that was taken out on this home.
Original Mortgage
$324,140
Interest Rate
4.5%
Purchase Details
Closed on
Dec 5, 2017
Sold by
Ingle Grady I and Bakatsias Chryssoula T
Bought by
Prof 2013-S3 Legal Title Trust Iv
Create a Home Valuation Report for This Property
The Home Valuation Report is an in-depth analysis detailing your home's value as well as a comparison with similar homes in the area
Home Values in the Area
Average Home Value in this Area
Purchase History
| Date | Buyer | Sale Price | Title Company |
|---|---|---|---|
| Freeman Revocable Trust | -- | None Listed On Document | |
| Freeman Revocable Trust | -- | None Listed On Document | |
| Vatter Michael Robert | $405,175 | Attorney | |
| Crean Carolyn D | -- | None Available | |
| Prof 2013-S3 Legal Title Trust Iv | $475,000 | None Available |
Source: Public Records
Mortgage History
| Date | Status | Borrower | Loan Amount |
|---|---|---|---|
| Previous Owner | Vatter Michael Robert | $324,140 |
Source: Public Records
Tax History Compared to Growth
Tax History
| Year | Tax Paid | Tax Assessment Tax Assessment Total Assessment is a certain percentage of the fair market value that is determined by local assessors to be the total taxable value of land and additions on the property. | Land | Improvement |
|---|---|---|---|---|
| 2025 | $3,613 | $731,276 | $60,000 | $671,276 |
| 2024 | $3,430 | $731,276 | $60,000 | $671,276 |
| 2023 | $3,159 | $731,276 | $60,000 | $671,276 |
| 2022 | $6,175 | $497,572 | $65,000 | $432,572 |
| 2021 | $6,225 | $497,572 | $65,000 | $432,572 |
| 2020 | $6,274 | $497,572 | $65,000 | $432,572 |
| 2019 | $6,291 | $497,572 | $65,000 | $432,572 |
| 2018 | $2,957 | $497,572 | $65,000 | $432,572 |
| 2017 | $2,871 | $497,572 | $65,000 | $432,572 |
| 2016 | $6,007 | $517,802 | $65,000 | $452,802 |
| 2015 | $2,988 | $517,802 | $65,000 | $452,802 |
| 2014 | $2,731 | $517,802 | $65,000 | $452,802 |
Source: Public Records
Map
Nearby Homes
- 128 Fieldstone Dr
- 3232 Hiddenwood Ln
- 115 Coachlight Trail
- 1246 Jamestowne Dr
- 240 Coachlight Trail
- 509 Fieldstone Dr
- 400 Brickwalk Ct
- 3489 Forestdale Dr Unit 2d
- 3489 Forestdale Dr Unit 1C
- 713 Mill Pointe Way
- 420 Collinwood Dr
- 3475 Forestdale Dr Unit 2a
- 2941 Amherst Ave
- 480 Whitt Ave
- 2825 Bedford St
- 418 Westhampton Dr
- 102 Westgate Dr
- 0 Garden Rd
- 3133 Brycewood Ct
- 3143 Brycewood Ct
- 3123 Brycewood Ct
- 3143 Brycewood Place
- 3130 Brycewood Place
- 3138 Brycewood Ct
- 3130 Brycewood Ct
- 3138 Brycewood Place
- 3115 Brycewood Ct
- 3115 Brycewood Place
- 772 Meadowood Dr
- 3108 Kensington Place
- 764 Meadowood Dr
- 3144 Brycewood Ct
- 3122 Brycewood Ct
- 756 Meadowood Dr
- 3118 Kensington Place
- 0 Kensington
- 3158 Brycewood Ct
- 3114 Brycewood Ct