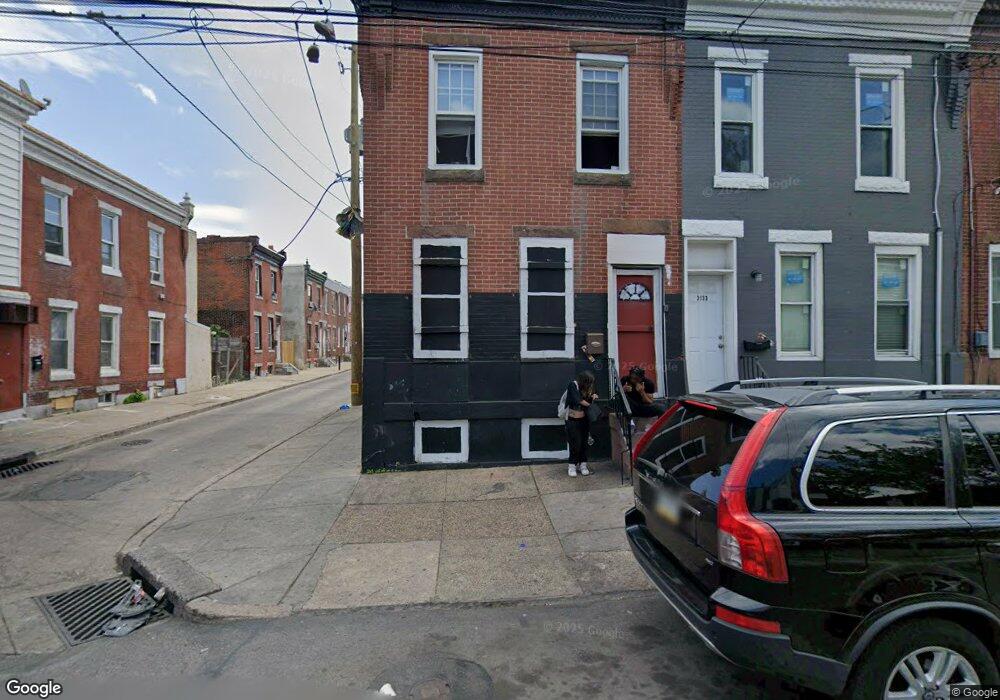
3133 Jasper St Unit 2ND FLOOR REAR Philadelphia, PA 19134
Port Richmond NeighborhoodEstimated Value: $96,423 - $259,000
1
Bed
1
Bath
1,168
Sq Ft
$153/Sq Ft
Est. Value
About This Home
This home is located at 3133 Jasper St Unit 2ND FLOOR REAR, Philadelphia, PA 19134 and is currently estimated at $178,606, approximately $152 per square foot. 3133 Jasper St Unit 2ND FLOOR REAR is a home located in Philadelphia County with nearby schools including Frances E. Willard Elementary School, Kensington High School, and Kensington Health Sciences Academy.
Ownership History
Date
Name
Owned For
Owner Type
Purchase Details
Closed on
Aug 23, 2022
Sold by
Ollie Homes Llc
Bought by
Ollie Genesis Llc
Current Estimated Value
Purchase Details
Closed on
May 15, 2021
Sold by
Cai Xiao Yu
Bought by
Ollie Homes Llc
Home Financials for this Owner
Home Financials are based on the most recent Mortgage that was taken out on this home.
Original Mortgage
$242,812
Interest Rate
3.09%
Mortgage Type
Construction
Purchase Details
Closed on
Apr 15, 2015
Sold by
Yu Jin D and Cai Xiao Yu
Bought by
Cai Xiao Yu
Purchase Details
Closed on
Jul 17, 2009
Sold by
Bello Kenneth L and Petrillo Gary
Bought by
Yu Jin D and Cai Xiao Yu
Purchase Details
Closed on
Jul 10, 2009
Sold by
Reichardt Margaret
Bought by
Bello Kenneth L and Petrillo Gary
Create a Home Valuation Report for This Property
The Home Valuation Report is an in-depth analysis detailing your home's value as well as a comparison with similar homes in the area
Home Values in the Area
Average Home Value in this Area
Purchase History
| Date | Buyer | Sale Price | Title Company |
|---|---|---|---|
| Ollie Genesis Llc | -- | Surety Abstract Services | |
| Ollie Homes Llc | $70,000 | Land Title | |
| Cai Xiao Yu | -- | None Available | |
| Yu Jin D | $32,000 | None Available | |
| Bello Kenneth L | $17,350 | None Available |
Source: Public Records
Mortgage History
| Date | Status | Borrower | Loan Amount |
|---|---|---|---|
| Previous Owner | Ollie Homes Llc | $242,812 |
Source: Public Records
Tax History Compared to Growth
Tax History
| Year | Tax Paid | Tax Assessment Tax Assessment Total Assessment is a certain percentage of the fair market value that is determined by local assessors to be the total taxable value of land and additions on the property. | Land | Improvement |
|---|---|---|---|---|
| 2025 | $983 | $82,800 | $16,560 | $66,240 |
| 2024 | $983 | $82,800 | $16,560 | $66,240 |
| 2023 | $983 | $70,200 | $14,040 | $56,160 |
| 2022 | $949 | $70,200 | $14,040 | $56,160 |
| 2021 | $949 | $0 | $0 | $0 |
| 2020 | $949 | $0 | $0 | $0 |
| 2019 | $882 | $0 | $0 | $0 |
| 2018 | $882 | $0 | $0 | $0 |
| 2017 | $882 | $0 | $0 | $0 |
| 2016 | $882 | $0 | $0 | $0 |
| 2015 | $662 | $0 | $0 | $0 |
| 2014 | -- | $49,400 | $7,045 | $42,355 |
| 2012 | -- | $5,696 | $865 | $4,831 |
Source: Public Records
Map
Nearby Homes
- 1844 E Clementine St
- 1932 E Lippincott St
- 1934 E Lippincott St
- 1863 E Lippincott St
- 1930 E Wishart St
- 1852 E Wishart St
- 1909 E Wishart St
- 3152 Emerald St
- 3127 Ruth St
- 1860 E Allegheny Ave
- 1834 E Allegheny Ave
- 3135 Kensington Ave
- 1830 E Allegheny Ave
- 3083 Emerald St
- 1917 E Allegheny Ave
- 1925 E Allegheny Ave
- 2039 E Clearfield St
- 2044 E Wishart St
- 2003 E Allegheny Ave
- 3074 Kensington Ave
- 3133 Jasper St
- 3131 Jasper St
- 3135 Jasper St
- 3129 Jasper St
- 2135 E Lippincott St
- 1906 E Lippincott St
- 3137 Jasper St
- 3127 Jasper St
- 1908 E Lippincott St
- 3139 Jasper St
- 3125 Jasper St
- 1910 E Lippincott St
- 1907 E Lippincott St
- 3141 Jasper St
- 3123 Jasper St
- 1912 E Lippincott St
- 1909 E Clementine St
- 3143 Jasper St
- 1907 E Clementine St
- 3136 Jasper St