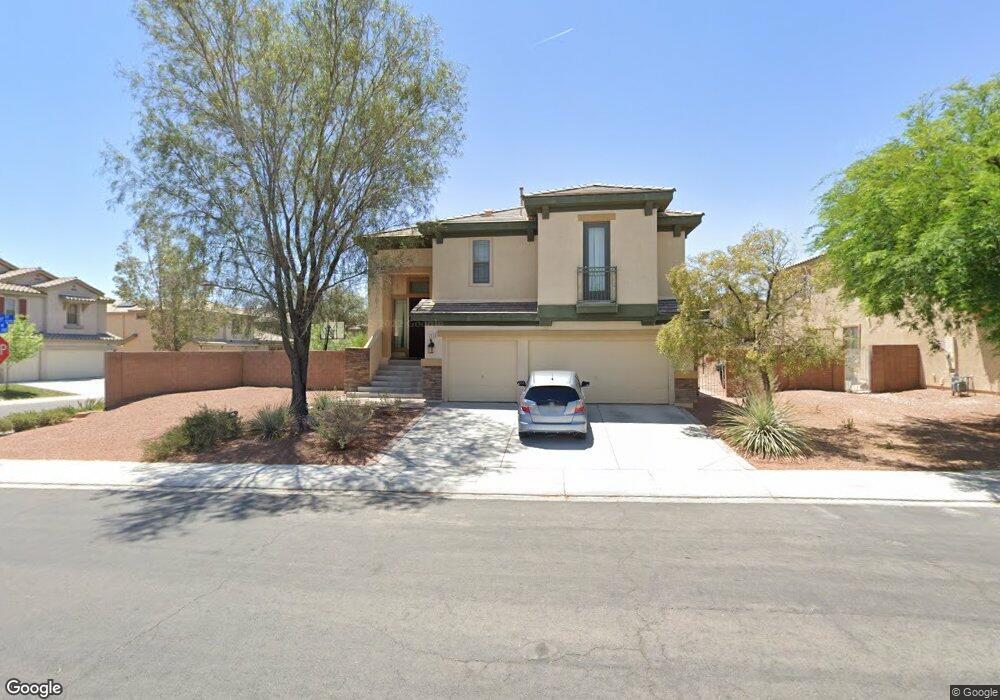
3133 Little Crimson Ave North Las Vegas, NV 89081
Northridge NeighborhoodEstimated Value: $477,774 - $492,000
4
Beds
3
Baths
2,294
Sq Ft
$212/Sq Ft
Est. Value
About This Home
This home is located at 3133 Little Crimson Ave, North Las Vegas, NV 89081 and is currently estimated at $487,444, approximately $212 per square foot. 3133 Little Crimson Ave is a home located in Clark County with nearby schools including John Tartan Elementary School, Clifford O. Findlay Middle School, and Mojave High School.
Ownership History
Date
Name
Owned For
Owner Type
Purchase Details
Closed on
May 12, 2008
Sold by
Nationstar Mortgage Llc
Bought by
Gil Tommy and Gil Grace
Current Estimated Value
Home Financials for this Owner
Home Financials are based on the most recent Mortgage that was taken out on this home.
Original Mortgage
$242,238
Outstanding Balance
$153,408
Interest Rate
5.88%
Mortgage Type
VA
Estimated Equity
$334,036
Purchase Details
Closed on
Nov 7, 2007
Sold by
Canuto Feliciano S
Bought by
Nationstar Mortgage Llc
Purchase Details
Closed on
Jul 8, 2005
Sold by
Canuto Feliciano S and Canuto Merly
Bought by
Canuto Feliciano S
Home Financials for this Owner
Home Financials are based on the most recent Mortgage that was taken out on this home.
Original Mortgage
$303,178
Interest Rate
6.65%
Mortgage Type
Fannie Mae Freddie Mac
Create a Home Valuation Report for This Property
The Home Valuation Report is an in-depth analysis detailing your home's value as well as a comparison with similar homes in the area
Home Values in the Area
Average Home Value in this Area
Purchase History
| Date | Buyer | Sale Price | Title Company |
|---|---|---|---|
| Gil Tommy | $234,500 | Equity Title Flamingo | |
| Nationstar Mortgage Llc | -- | Equity Title Flamingo | |
| Nationstar Mortgage Llc | $325,011 | Accommodation | |
| Canuto Feliciano S | -- | Commerce Title | |
| Canuto Feliciano S | $378,973 | Commerce Title |
Source: Public Records
Mortgage History
| Date | Status | Borrower | Loan Amount |
|---|---|---|---|
| Open | Gil Tommy | $242,238 | |
| Previous Owner | Canuto Feliciano S | $303,178 |
Source: Public Records
Tax History Compared to Growth
Tax History
| Year | Tax Paid | Tax Assessment Tax Assessment Total Assessment is a certain percentage of the fair market value that is determined by local assessors to be the total taxable value of land and additions on the property. | Land | Improvement |
|---|---|---|---|---|
| 2025 | $2,758 | $143,524 | $39,200 | $104,324 |
| 2024 | $2,554 | $143,524 | $39,200 | $104,324 |
| 2023 | $2,554 | $131,761 | $33,250 | $98,511 |
| 2022 | $2,366 | $115,147 | $30,800 | $84,347 |
| 2021 | $2,191 | $106,231 | $28,700 | $77,531 |
| 2020 | $2,031 | $100,251 | $28,700 | $71,551 |
| 2019 | $1,904 | $96,243 | $23,450 | $72,793 |
| 2018 | $1,816 | $84,011 | $18,900 | $65,111 |
| 2017 | $2,612 | $77,857 | $17,500 | $60,357 |
| 2016 | $1,701 | $67,486 | $14,000 | $53,486 |
| 2015 | $1,697 | $58,460 | $10,500 | $47,960 |
| 2014 | $1,644 | $47,554 | $8,400 | $39,154 |
Source: Public Records
Map
Nearby Homes
- 3112 Winter Sunset Ave
- 3112 Blush Noisette Ave
- 5733 Awakening St
- 5828 Autumn Damask St
- 3032 Prairie Princess Ave
- 3405 Brook Song Ave
- 5650 Pleasant Palms St
- 5629 Sagamore Canyon St
- 5654 Sagamore Canyon St
- 5745 Sagamore Canyon St
- 5721 Keystone Crest St
- 2813 White Peaks Ave
- 3605 Greenbriar Bluff Ave
- 5536 Punto Del Castello Ct
- 2809 Kandahar Ave
- 3612 Turquoise Waters Ave
- 3156 Mclennan Ave
- 5953 Addy Ln
- 5913 Saratoga Reserve St
- 5805 Hannah Brook St
- 3129 Little Crimson Ave
- 3132 Madame Plantier Ave
- 3125 Little Crimson Ave
- 5705 Pacesetter St
- 3128 Madame Plantier Ave
- 5632 Pacesetter St
- 5704 Earthsong Ct
- 5628 Pacesetter St
- 3124 Madame Plantier Ave
- 3121 Little Crimson Ave
- 5704 Pacesetter St
- 5709 Pacesetter St
- 5624 Pacesetter St
- 5708 Earthsong Ct
- 5708 Pacesetter St
- 3120 Madame Plantier Ave
- 5620 Pacesetter St
- 5620 Pacesetter St
- 5620 Pacesetter St
- 3117 Little Crimson Ave