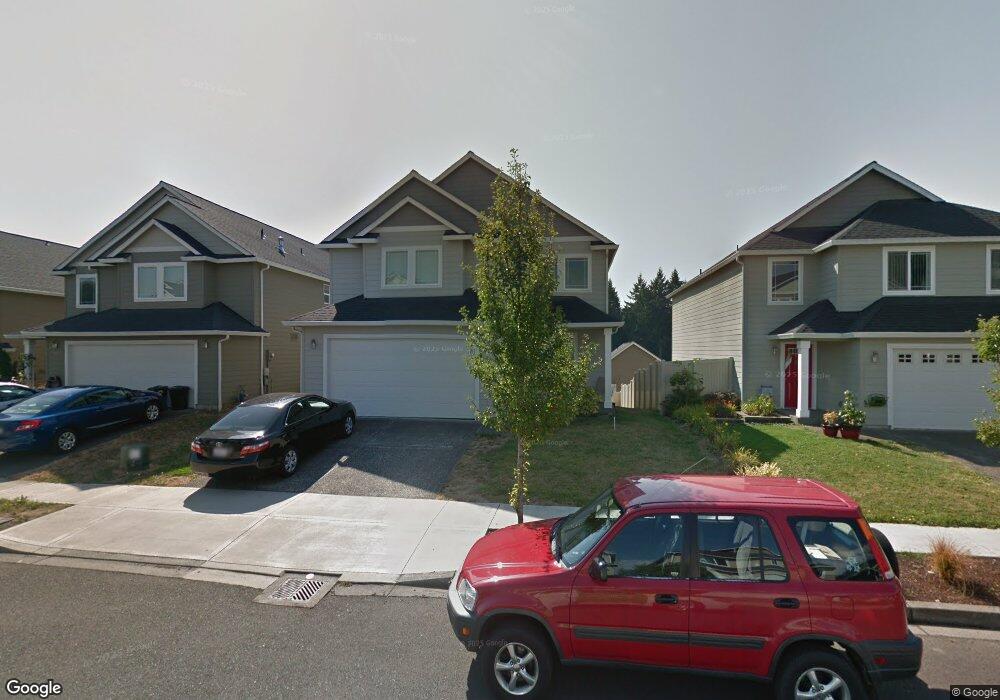
3133 S 2nd St Ridgefield, WA 98642
Estimated Value: $467,000 - $548,000
4
Beds
3
Baths
2,230
Sq Ft
$233/Sq Ft
Est. Value
About This Home
This home is located at 3133 S 2nd St, Ridgefield, WA 98642 and is currently estimated at $519,096, approximately $232 per square foot. 3133 S 2nd St is a home located in Clark County with nearby schools including Ridgefield High School and Mountain View Christian School.
Ownership History
Date
Name
Owned For
Owner Type
Purchase Details
Closed on
Oct 27, 2010
Sold by
Aurora Loan Services Llc
Bought by
Billingsley Michael Mark and Billingsley Darcy Lynn
Current Estimated Value
Home Financials for this Owner
Home Financials are based on the most recent Mortgage that was taken out on this home.
Original Mortgage
$112,500
Outstanding Balance
$73,847
Interest Rate
4.17%
Mortgage Type
New Conventional
Estimated Equity
$445,249
Purchase Details
Closed on
Jul 8, 2010
Sold by
Devereaux Andy R
Bought by
Aurora Loan Services Llc
Purchase Details
Closed on
Nov 6, 2006
Sold by
Devereaux Heather
Bought by
Devereaux Andy R
Home Financials for this Owner
Home Financials are based on the most recent Mortgage that was taken out on this home.
Original Mortgage
$287,659
Interest Rate
6.3%
Mortgage Type
Unknown
Create a Home Valuation Report for This Property
The Home Valuation Report is an in-depth analysis detailing your home's value as well as a comparison with similar homes in the area
Home Values in the Area
Average Home Value in this Area
Purchase History
| Date | Buyer | Sale Price | Title Company |
|---|---|---|---|
| Billingsley Michael Mark | $150,000 | Chicago Title Ins Co Lsi Div | |
| Aurora Loan Services Llc | $195,000 | None Available | |
| Devereaux Andy R | -- | First American Title | |
| Devereaux Andy R | $287,658 | First American Title |
Source: Public Records
Mortgage History
| Date | Status | Borrower | Loan Amount |
|---|---|---|---|
| Open | Billingsley Michael Mark | $112,500 | |
| Previous Owner | Devereaux Andy R | $287,659 |
Source: Public Records
Tax History Compared to Growth
Tax History
| Year | Tax Paid | Tax Assessment Tax Assessment Total Assessment is a certain percentage of the fair market value that is determined by local assessors to be the total taxable value of land and additions on the property. | Land | Improvement |
|---|---|---|---|---|
| 2025 | $4,320 | $488,946 | $145,000 | $343,946 |
| 2024 | $4,155 | $487,482 | $145,000 | $342,482 |
| 2023 | $3,917 | $499,614 | $145,000 | $354,614 |
| 2022 | $3,477 | $450,725 | $117,351 | $333,374 |
| 2021 | $3,358 | $374,260 | $97,500 | $276,760 |
| 2020 | $3,361 | $338,158 | $91,000 | $247,158 |
| 2019 | $3,261 | $333,840 | $86,678 | $247,162 |
| 2018 | $3,345 | $327,299 | $0 | $0 |
| 2017 | $2,565 | $289,879 | $0 | $0 |
| 2016 | $2,358 | $262,498 | $0 | $0 |
| 2015 | $2,368 | $231,300 | $0 | $0 |
| 2014 | -- | $222,315 | $0 | $0 |
| 2013 | -- | $188,199 | $0 | $0 |
Source: Public Records
Map
Nearby Homes
- 3150 S 3rd Way
- 3117 S 1st St
- 3047 S Cedar Ridge Dr
- 3204 S 2nd Way
- 2650 S 4th Way
- 208 N 30th Dr
- 2805 N 2nd Way
- 4784 Pioneer St
- 252 N 30th Dr
- 8729 S 4th Way
- 8737 S 4th Way
- 1108 S 48th Place
- 2606 S 6th Way
- 2611 6th Way
- 2607 S 6th Way
- 2603 S 6th Way
- 251 N Green Gables Loop
- 2611 S 6th Way
- 2602 S 7th Way
- 2510 S 6th Way