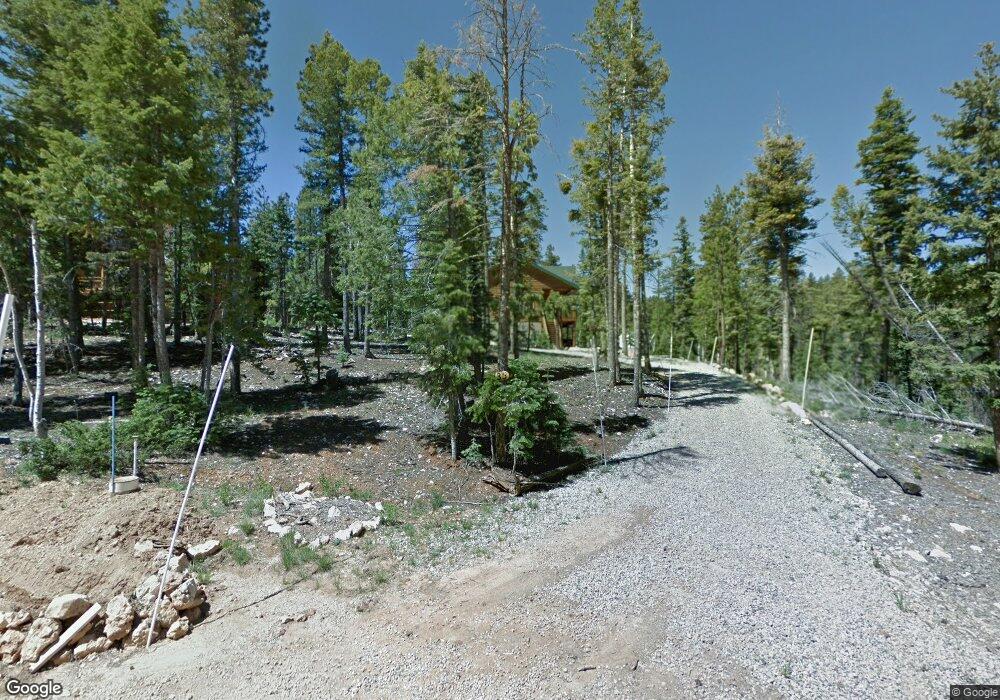
3135 N Pinecrest Dr Tt 35 Duck Creek, UT 84762
Duck Creek Village NeighborhoodEstimated Value: $91,000 - $657,000
3
Beds
3
Baths
2,180
Sq Ft
$211/Sq Ft
Est. Value
About This Home
This home is located at 3135 N Pinecrest Dr Tt 35, Duck Creek, UT 84762 and is currently estimated at $460,372, approximately $211 per square foot. 3135 N Pinecrest Dr Tt 35 is a home located in Kane County with nearby schools including Valley Elementary School and Valley High School.
Ownership History
Date
Name
Owned For
Owner Type
Purchase Details
Closed on
Jun 20, 2016
Sold by
Gordon James P Trust
Bought by
Davis David Guy and Davis Patricia
Current Estimated Value
Purchase Details
Closed on
Mar 7, 2014
Sold by
James P James P
Bought by
Gordon James Patrick and James Patrick Gordon Trust
Purchase Details
Closed on
Jan 30, 2012
Sold by
Hartley Edward K and Hartley Linda M
Bought by
Gordon James P
Home Financials for this Owner
Home Financials are based on the most recent Mortgage that was taken out on this home.
Original Mortgage
$224,800
Interest Rate
3.88%
Purchase Details
Closed on
Jan 9, 2012
Sold by
Mers
Bought by
Halliday Paul M
Home Financials for this Owner
Home Financials are based on the most recent Mortgage that was taken out on this home.
Original Mortgage
$224,800
Interest Rate
3.88%
Purchase Details
Closed on
Mar 28, 2008
Sold by
Hartley Edward K and Hartley Linda M
Bought by
Hartley Edward K and Hartley Linda M
Create a Home Valuation Report for This Property
The Home Valuation Report is an in-depth analysis detailing your home's value as well as a comparison with similar homes in the area
Home Values in the Area
Average Home Value in this Area
Purchase History
| Date | Buyer | Sale Price | Title Company |
|---|---|---|---|
| Davis David Guy | -- | -- | |
| Gordon James Patrick | -- | -- | |
| Gordon James P | -- | -- | |
| Halliday Paul M | -- | -- | |
| Hartley Edward K | -- | -- |
Source: Public Records
Mortgage History
| Date | Status | Borrower | Loan Amount |
|---|---|---|---|
| Previous Owner | Gordon James P | $224,800 |
Source: Public Records
Tax History Compared to Growth
Tax History
| Year | Tax Paid | Tax Assessment Tax Assessment Total Assessment is a certain percentage of the fair market value that is determined by local assessors to be the total taxable value of land and additions on the property. | Land | Improvement |
|---|---|---|---|---|
| 2025 | $4,484 | $671,076 | $131,670 | $539,406 |
| 2024 | $4,484 | $355,392 | $80,465 | $274,927 |
| 2023 | $3,883 | $326,865 | $77,838 | $249,027 |
| 2022 | $3,843 | $286,263 | $59,875 | $226,388 |
| 2021 | $3,266 | $365,380 | $60,480 | $304,900 |
| 2020 | $2,990 | $322,798 | $60,480 | $262,318 |
| 2019 | $2,914 | $305,883 | $60,480 | $245,403 |
| 2018 | $2,924 | $304,276 | $60,940 | $243,336 |
| 2017 | $2,530 | $252,028 | $55,400 | $196,628 |
| 2016 | $2,600 | $252,028 | $55,400 | $196,628 |
| 2015 | $2,358 | $252,028 | $55,400 | $196,628 |
| 2014 | $2,358 | $228,039 | $55,400 | $172,639 |
| 2013 | -- | $113,470 | $0 | $0 |
Source: Public Records
Map
Nearby Homes
- 1065 E Redwood Rd
- 1050 E Shivwits Ln
- 3465 Ute Ln
- 1070 E Bonanza Rd
- 2965 Browning Rd
- 1050 Redwood Rd
- 1075 Winchester Rd
- 770 Utah 14
- 695 Movie Ranch Rd Unit DCP 11
- 1010 E Pioneer Rd
- 1175 Browning Rd
- 3185 N Henry Rd
- 3190 Henry Rd
- 3190 N Henry Rd
- 1290 Henry Rd
- 1255 Redwood Rd
- 1255 Browning Rd
- 1255 E Browning
- 1340 E South Mossberg Rd
- 205 E Rim Rd Unit E
- 3135 Pinecrest Dr Unit TT 35
- 3135 Pinecrest Dr
- 3135 Pine Crest Dr
- 3135 Pine Crest Dr Unit TT 35
- 3125 N Pinecrest Dr
- 3105 N Silver Tip Ln
- 3115 Pine Crest Dr
- 3115 N Pinecrest Dr
- 3165 N Pinecrest Dr
- 3095 N Silver Tip Ln Unit Timber Trails Lot 39
- 3095 N Silver Tip Ln
- 3140 N Pinecrest Dr
- 3085 N Silver Tip Ln
- 3120 N Pinecrest Dr
- 3140 Pinecrest Dr Unit TT 18-19
- 3140 Pinecrest Dr
- 71 Evergreen Dr Unit Bryce Woodlands Est
- 71 Evergreen Dr Unit 3
- 655 N Evergreen Dr
- 3110 N Silver Tip Ln