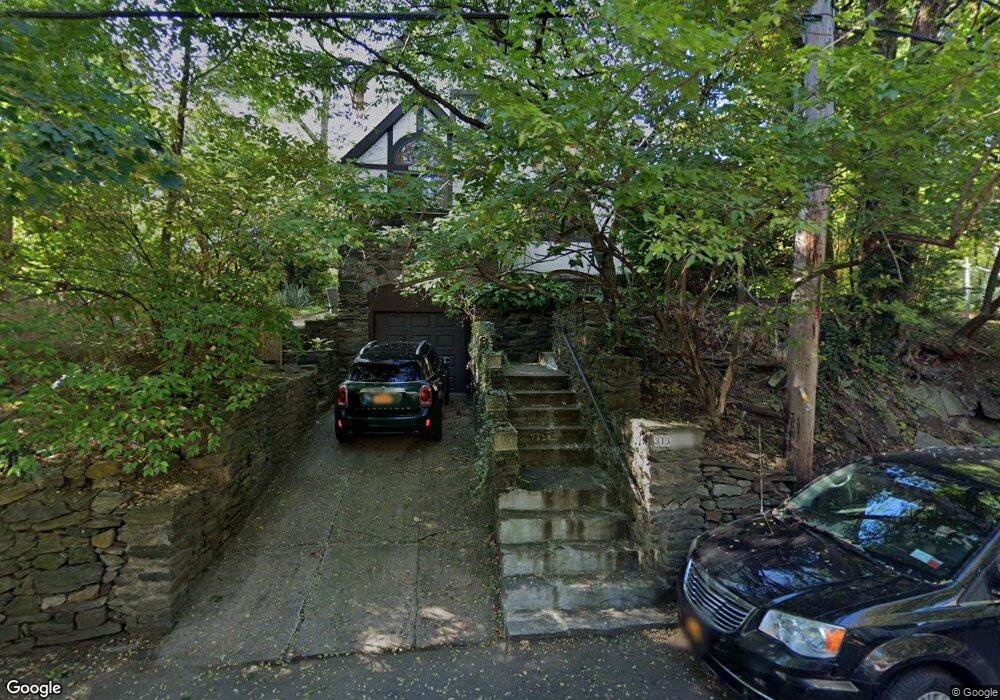
3135 Netherland Ave Bronx, NY 10463
Spuyten Duyvil NeighborhoodEstimated Value: $1,519,586 - $2,041,000
5
Beds
3
Baths
3,743
Sq Ft
$456/Sq Ft
Est. Value
About This Home
This home is located at 3135 Netherland Ave, Bronx, NY 10463 and is currently estimated at $1,706,397, approximately $455 per square foot. 3135 Netherland Ave is a home located in Bronx County with nearby schools including P.S. 24 Spuyten Duyvil, Riverdale Kingsbridge Academy, and St. Gabriel Elementary School.
Ownership History
Date
Name
Owned For
Owner Type
Purchase Details
Closed on
Apr 8, 2021
Sold by
Bernsteein Gaya Aranoff
Bought by
Goldberg Zachary and Ludwin Danielle
Current Estimated Value
Home Financials for this Owner
Home Financials are based on the most recent Mortgage that was taken out on this home.
Original Mortgage
$1,200,000
Outstanding Balance
$1,084,322
Interest Rate
3.05%
Mortgage Type
Purchase Money Mortgage
Estimated Equity
$622,075
Purchase Details
Closed on
Mar 5, 2019
Sold by
Bernstein Joshua and Bernstein Kyra
Bought by
Bernstein Gaya A
Purchase Details
Closed on
Jan 10, 2019
Sold by
Bernstein Children'S Trust
Bought by
Bernstein Joshua and Bernstein Kyra
Purchase Details
Closed on
Jan 18, 2017
Sold by
Bernstein 2012 Qualified Personal Reside
Bought by
Bernstein Children'S Trust
Purchase Details
Closed on
Dec 21, 2012
Sold by
Aranoff Bernstein Gaya
Bought by
Bernstein 2012 Qualified Personal Reside and Gaya Aranoff Bernstein
Create a Home Valuation Report for This Property
The Home Valuation Report is an in-depth analysis detailing your home's value as well as a comparison with similar homes in the area
Home Values in the Area
Average Home Value in this Area
Purchase History
| Date | Buyer | Sale Price | Title Company |
|---|---|---|---|
| Goldberg Zachary | $1,500,000 | -- | |
| Bernstein Gaya A | -- | -- | |
| Bernstein Joshua | $1,750,000 | -- | |
| Bernstein Children'S Trust | -- | -- | |
| Bernstein 2012 Qualified Personal Reside | -- | -- |
Source: Public Records
Mortgage History
| Date | Status | Borrower | Loan Amount |
|---|---|---|---|
| Open | Goldberg Zachary | $1,200,000 |
Source: Public Records
Tax History Compared to Growth
Tax History
| Year | Tax Paid | Tax Assessment Tax Assessment Total Assessment is a certain percentage of the fair market value that is determined by local assessors to be the total taxable value of land and additions on the property. | Land | Improvement |
|---|---|---|---|---|
| 2025 | $11,589 | $61,163 | $12,115 | $49,048 |
| 2024 | $11,589 | $57,701 | $12,768 | $44,933 |
| 2023 | $11,055 | $54,436 | $13,993 | $40,443 |
| 2022 | $10,253 | $78,060 | $18,600 | $59,460 |
| 2021 | $10,808 | $78,180 | $18,600 | $59,580 |
| 2020 | $10,789 | $86,400 | $18,600 | $67,800 |
| 2019 | $10,059 | $80,640 | $18,600 | $62,040 |
| 2018 | $9,247 | $45,363 | $10,440 | $34,923 |
| 2017 | $8,724 | $42,798 | $11,963 | $30,835 |
| 2016 | $8,556 | $42,798 | $12,138 | $30,660 |
| 2015 | $4,650 | $42,475 | $14,729 | $27,746 |
| 2014 | $4,650 | $40,071 | $14,774 | $25,297 |
Source: Public Records
Map
Nearby Homes
- 3210 Arlington Ave Unit 2J
- 3210 Arlington Ave Unit 3B
- 3215 Netherland Ave Unit 5C
- 3215 Netherland Ave Unit 6C
- 3215 Arlington Ave Unit 3H
- 3200 Netherland Ave Unit 6H
- 3200 Netherland Ave Unit D
- 3200 Netherland Ave Unit 3K
- 3200 Netherland Ave Unit 4
- 3220 Fairfield Ave Unit 6A
- 3220 Fairfield Ave Unit 6D
- 3115 Netherland Ave
- 3260 Netherland Ave Unit 5F
- 3260 Netherland Ave Unit 5C
- 3135 Johnson Ave Unit 16C
- 3135 Johnson Ave Unit 9A
- 3135 Johnson Ave Unit 5G
- 3103 Fairfield Ave Unit 4A
- 3103 Fairfield Ave Unit 5D
- 3333 Henry Hudson Pkwy Unit 19G
- 3130 Arlington Ave
- 3126 Arlington Ave
- 3129 Netherland Ave
- 3124 Arlington Ave
- 3122 Arlington Ave
- 3122 Arlington Ave Unit 2
- 3122 Arlington Ave Unit TH
- 551 W 232nd St Unit 66
- 3116 Arlington Ave
- 3140 Netherland Ave
- 3130 Netherland Ave
- 3110 Arlington Ave
- 3215 Netherland Ave Unit 6A
- 3215 Netherland Ave Unit 3H
- 3215 Netherland Ave Unit 1F
- 3215 Netherland Ave Unit 3C
- 3215 Netherland Ave Unit 6H
- 3215 Netherland Ave Unit 6G
- 3215 Netherland Ave Unit 2A
- 3215 Netherland Ave Unit 6D