Estimated Value: $472,000 - $613,000
5
Beds
3
Baths
3,120
Sq Ft
$171/Sq Ft
Est. Value
About This Home
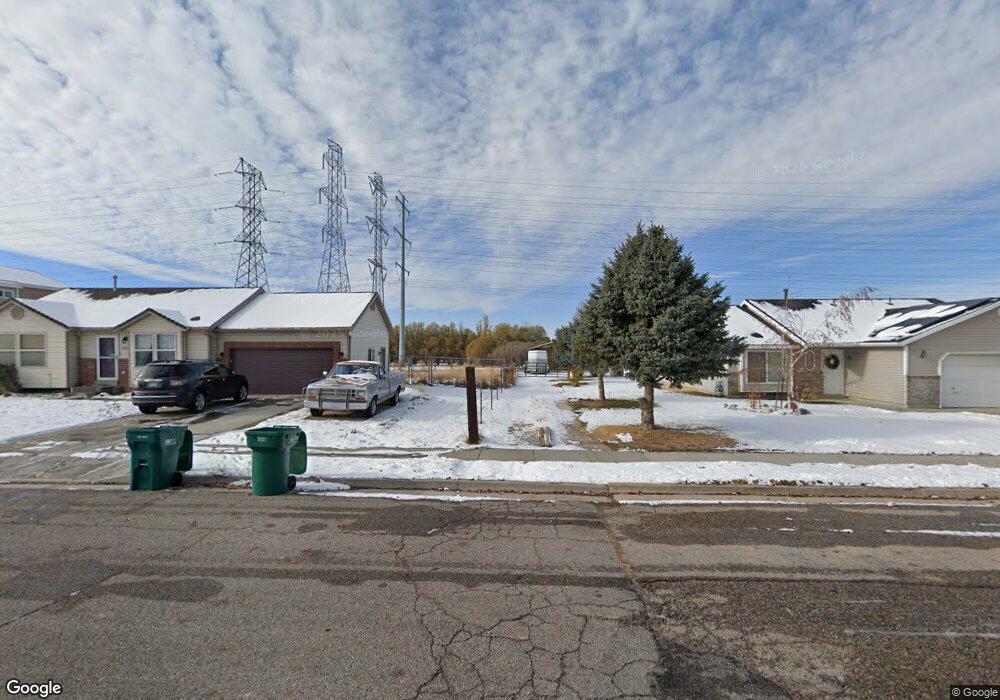
This home is located at 3136 W 5600 S, Roy, UT 84067 and is currently estimated at $534,163, approximately $171 per square foot. 3136 W 5600 S is a home located in Weber County with nearby schools including Roy Elementary School, Roy Junior High School, and Roy High School.
Ownership History
Date
Name
Owned For
Owner Type
Purchase Details
Closed on
Jul 30, 2008
Sold by
The Dai & Sumi Yoshimura Trust and Yoshimura Daiichi
Bought by
Opheikens Mark
Current Estimated Value
Home Financials for this Owner
Home Financials are based on the most recent Mortgage that was taken out on this home.
Original Mortgage
$182,141
Outstanding Balance
$120,013
Interest Rate
6.41%
Mortgage Type
FHA
Estimated Equity
$414,150
Purchase Details
Closed on
Apr 3, 2003
Sold by
Yoshimura Daiichi and Yoshimura Sumi
Bought by
Yoshimura Daiichi and Yoshimura Sumi
Create a Home Valuation Report for This Property
The Home Valuation Report is an in-depth analysis detailing your home's value as well as a comparison with similar homes in the area
Home Values in the Area
Average Home Value in this Area
Purchase History
| Date | Buyer | Sale Price | Title Company |
|---|---|---|---|
| Opheikens Mark | -- | Inwest Title | |
| Yoshimura Daiichi | -- | -- |
Source: Public Records
Mortgage History
| Date | Status | Borrower | Loan Amount |
|---|---|---|---|
| Open | Opheikens Mark | $182,141 |
Source: Public Records
Tax History
| Year | Tax Paid | Tax Assessment Tax Assessment Total Assessment is a certain percentage of the fair market value that is determined by local assessors to be the total taxable value of land and additions on the property. | Land | Improvement |
|---|---|---|---|---|
| 2025 | $3,147 | $504,299 | $123,042 | $381,257 |
| 2024 | $3,068 | $272,249 | $67,673 | $204,576 |
| 2023 | $2,885 | $255,750 | $65,823 | $189,927 |
| 2022 | $2,851 | $259,050 | $57,663 | $201,387 |
| 2021 | $2,323 | $346,000 | $77,824 | $268,176 |
| 2020 | $2,186 | $299,000 | $77,824 | $221,176 |
| 2019 | $2,181 | $282,000 | $55,305 | $226,695 |
| 2018 | $2,070 | $252,000 | $55,305 | $196,695 |
| 2017 | $1,962 | $224,000 | $49,870 | $174,130 |
| 2016 | $1,892 | $116,244 | $26,027 | $90,217 |
| 2015 | $1,837 | $116,244 | $23,247 | $92,997 |
| 2014 | $1,853 | $116,244 | $23,247 | $92,997 |
Source: Public Records
Map
Nearby Homes
- 3166 W 5625 S
- 3176 W 5625 S
- 5321 S 3100 W
- 5304 S 3100 W
- 5791 S 3260 W
- 2907 W 5775 S
- 5998 S 3100 W
- 5999 S 3200 W
- 3009 W 6000 S
- 2829 W 5925 S
- 5141 S 2975 W
- 2932 W 6050 S
- 3443 W 5200 S Unit 2&3
- 3402 W 6000 S
- 2646 W 5625 S Unit M-2646
- 2627 W 5625 S
- 5173 S 2825 W
- 5009 S 2925 W
- 5063 S 2825 W
- 2571 W 5725 S