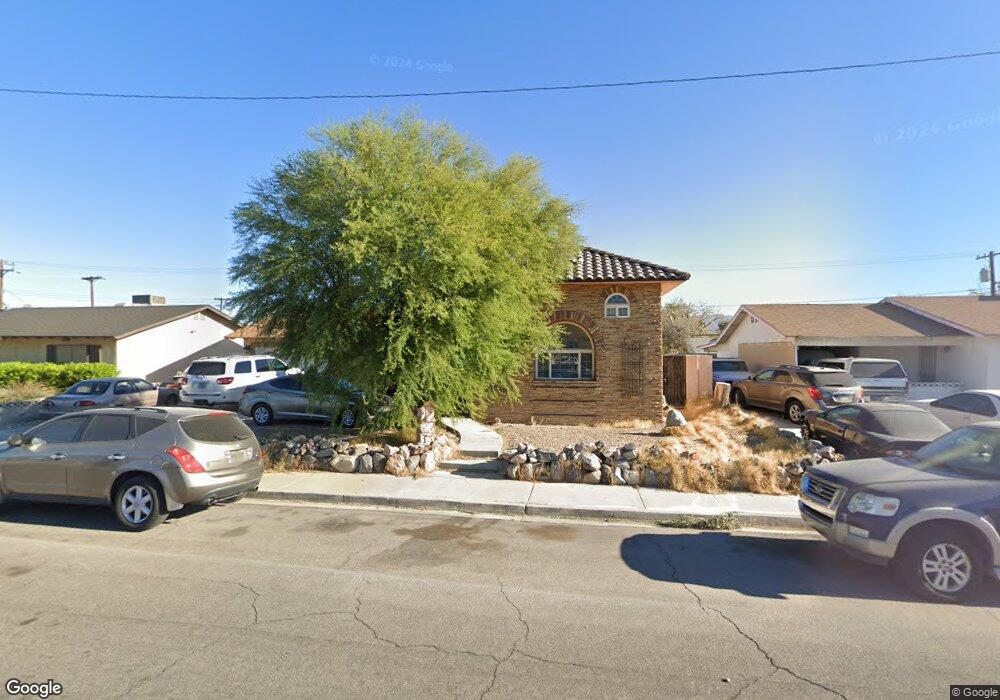
3136 Westfield St Las Vegas, NV 89121
Estimated Value: $389,000 - $438,000
3
Beds
2
Baths
2,104
Sq Ft
$192/Sq Ft
Est. Value
About This Home
This home is located at 3136 Westfield St, Las Vegas, NV 89121 and is currently estimated at $403,775, approximately $191 per square foot. 3136 Westfield St is a home located in Clark County with nearby schools including Will Beckley Elementary School, Jerome Mack Middle School, and Chaparral High School.
Ownership History
Date
Name
Owned For
Owner Type
Purchase Details
Closed on
Sep 18, 2017
Sold by
Johanson Jane
Bought by
Rojas Sonia M
Current Estimated Value
Home Financials for this Owner
Home Financials are based on the most recent Mortgage that was taken out on this home.
Original Mortgage
$188,237
Outstanding Balance
$159,657
Interest Rate
4.5%
Mortgage Type
FHA
Estimated Equity
$244,118
Purchase Details
Closed on
Mar 28, 2011
Sold by
Nevada State Bank
Bought by
Lillian M Johnson Revocable Living Trust
Purchase Details
Closed on
Jan 14, 2011
Sold by
Candela Ginger H
Bought by
Nevada State Bank
Purchase Details
Closed on
Sep 6, 2006
Sold by
Candela Eric W
Bought by
Candela Ginger H
Purchase Details
Closed on
Apr 4, 1997
Sold by
Candella Warren L and Candella Janis M
Bought by
Candela Eric W and Candela Ginger H
Purchase Details
Closed on
Dec 23, 1994
Sold by
Page Robert J and Piccininni Robert J
Bought by
Candella Warren L and Candella Janis M
Create a Home Valuation Report for This Property
The Home Valuation Report is an in-depth analysis detailing your home's value as well as a comparison with similar homes in the area
Home Values in the Area
Average Home Value in this Area
Purchase History
| Date | Buyer | Sale Price | Title Company |
|---|---|---|---|
| Rojas Sonia M | $195,000 | Ticor Title Las Vegas | |
| Lillian M Johnson Revocable Living Trust | $71,075 | Ticor Title Las Vegas | |
| Nevada State Bank | $83,259 | First American National Def | |
| Candela Ginger H | -- | National Alliance Title | |
| Candela Eric W | $45,000 | -- | |
| Candella Warren L | $60,000 | Stewart Title |
Source: Public Records
Mortgage History
| Date | Status | Borrower | Loan Amount |
|---|---|---|---|
| Open | Rojas Sonia M | $188,237 |
Source: Public Records
Tax History Compared to Growth
Tax History
| Year | Tax Paid | Tax Assessment Tax Assessment Total Assessment is a certain percentage of the fair market value that is determined by local assessors to be the total taxable value of land and additions on the property. | Land | Improvement |
|---|---|---|---|---|
| 2025 | $1,453 | $62,170 | $28,350 | $33,820 |
| 2024 | $1,411 | $62,170 | $28,350 | $33,820 |
| 2023 | $1,411 | $68,445 | $34,650 | $33,795 |
| 2022 | $1,370 | $57,618 | $25,900 | $31,718 |
| 2021 | $1,391 | $54,353 | $23,450 | $30,903 |
| 2020 | $1,289 | $55,462 | $24,150 | $31,312 |
| 2019 | $1,208 | $51,002 | $19,600 | $31,402 |
| 2018 | $1,152 | $47,905 | $17,150 | $30,755 |
| 2017 | $1,412 | $48,157 | $16,450 | $31,707 |
| 2016 | $1,080 | $44,433 | $11,550 | $32,883 |
| 2015 | $1,077 | $42,867 | $9,100 | $33,767 |
| 2014 | $1,043 | $37,352 | $7,000 | $30,352 |
Source: Public Records
Map
Nearby Homes
- 3085 Greenbriar Dr
- 275 Pecos Way
- 3169 Nottingham Dr
- 241 Pecos Way Unit 6
- 233 Pecos Way
- 431 Las Casitas Way
- 3078 S Pecos Rd
- 3435 Don Miguel Dr
- 747 Greenbriar Townhouse Way
- 3258 Glenhurst Dr
- 3410 Pecos Way
- 3428 Don Miguel Dr
- 565 Greenbriar Townhouse Way
- 335 Greenbriar Townhouse Way
- 3453 Del Marino Dr
- 466 Las Casitas Way
- 225 Greenbriar Townhouse Way
- 3247 Greenbriar Dr
- 3378 Del Marino St
- 3558 Wayne Cir
- 3144 Westfield St
- 3128 Westfield St
- 3115 Oxford Ln
- 3107 Oxford Ln
- 3123 Oxford Ln
- 3120 Westfield St
- 3152 Westfield St
- 3149 Westfield Cir
- 3132 Nottingham Dr
- 3132 Nottingham Dr Unit n/a
- 3099 Oxford Ln
- 3131 Oxford Ln
- 3112 Westfield St
- 3160 Westfield St
- 3140 Nottingham Dr
- 3139 Oxford Ln
- 3169 Westfield Cir
- 3108 Oxford Ln Unit 3
- 3155 Westfield Cir
- 3116 Oxford Ln