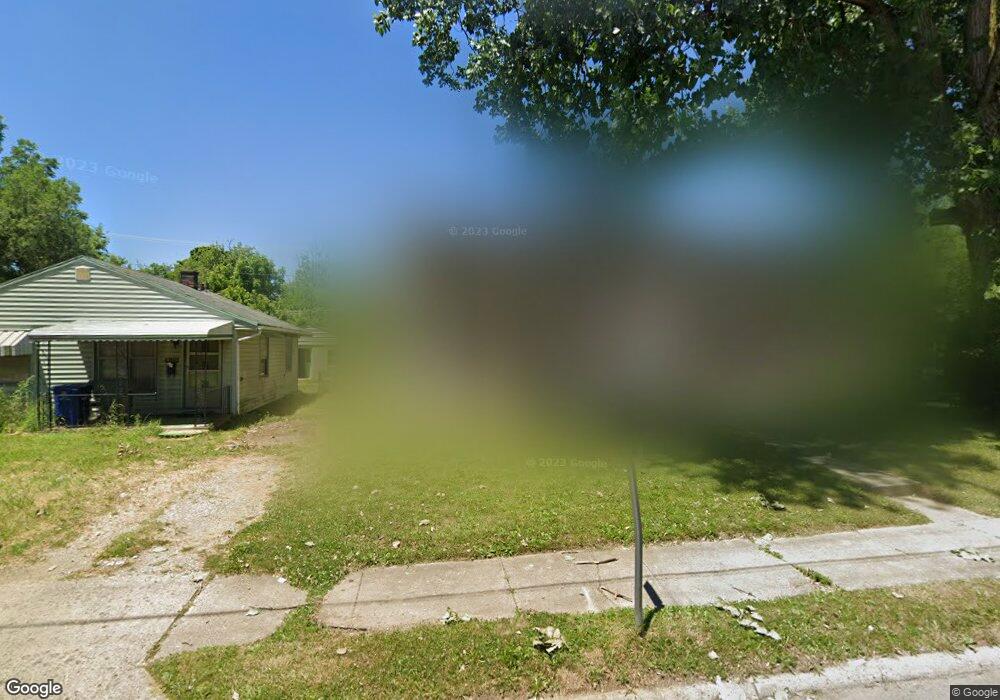
3137 McGuffey Rd Unit 141 Columbus, OH 43224
North Linden NeighborhoodEstimated Value: $242,000 - $426,000
6
Beds
3
Baths
2,640
Sq Ft
$127/Sq Ft
Est. Value
About This Home
This home is located at 3137 McGuffey Rd Unit 141, Columbus, OH 43224 and is currently estimated at $334,000, approximately $126 per square foot. 3137 McGuffey Rd Unit 141 is a home located in Franklin County with nearby schools including Como Elementary School, Dominion Middle School, and Whetstone High School.
Ownership History
Date
Name
Owned For
Owner Type
Purchase Details
Closed on
Aug 14, 2020
Sold by
North Linden Llc
Bought by
Trimbak Llc
Current Estimated Value
Home Financials for this Owner
Home Financials are based on the most recent Mortgage that was taken out on this home.
Original Mortgage
$228,000
Outstanding Balance
$201,875
Interest Rate
2.9%
Mortgage Type
Construction
Estimated Equity
$132,125
Purchase Details
Closed on
Mar 15, 2019
Sold by
Ricketts Robert R
Bought by
North Linden Llc
Home Financials for this Owner
Home Financials are based on the most recent Mortgage that was taken out on this home.
Original Mortgage
$180,000
Interest Rate
4.4%
Mortgage Type
New Conventional
Purchase Details
Closed on
Sep 24, 2002
Sold by
Price Carl G and Price Patricia M
Bought by
Ricketts Robert R
Purchase Details
Closed on
Mar 3, 1976
Bought by
Price Carl J Et Al 4
Create a Home Valuation Report for This Property
The Home Valuation Report is an in-depth analysis detailing your home's value as well as a comparison with similar homes in the area
Home Values in the Area
Average Home Value in this Area
Purchase History
| Date | Buyer | Sale Price | Title Company |
|---|---|---|---|
| Trimbak Llc | $305,000 | Associates Title Inc | |
| North Linden Llc | $225,000 | Stewart Title Box | |
| Ricketts Robert R | $50,100 | -- | |
| Ricketts Robert R | $50,100 | Chicago Title Commercial | |
| Price Carl J Et Al 4 | -- | -- |
Source: Public Records
Mortgage History
| Date | Status | Borrower | Loan Amount |
|---|---|---|---|
| Open | Trimbak Llc | $228,000 | |
| Previous Owner | North Linden Llc | $180,000 |
Source: Public Records
Tax History Compared to Growth
Tax History
| Year | Tax Paid | Tax Assessment Tax Assessment Total Assessment is a certain percentage of the fair market value that is determined by local assessors to be the total taxable value of land and additions on the property. | Land | Improvement |
|---|---|---|---|---|
| 2024 | $3,407 | $74,340 | $11,060 | $63,280 |
| 2023 | $3,364 | $74,340 | $11,060 | $63,280 |
| 2022 | $2,829 | $53,240 | $3,120 | $50,120 |
| 2021 | $2,391 | $53,240 | $3,120 | $50,120 |
| 2020 | $1,823 | $34,200 | $3,120 | $31,080 |
| 2019 | $1,844 | $29,650 | $3,120 | $26,530 |
| 2018 | $1,993 | $29,650 | $3,120 | $26,530 |
| 2017 | $1,843 | $29,650 | $3,120 | $26,530 |
| 2016 | $2,357 | $34,690 | $3,050 | $31,640 |
| 2015 | $2,146 | $34,690 | $3,050 | $31,640 |
| 2014 | $2,151 | $34,690 | $3,050 | $31,640 |
| 2013 | $1,179 | $38,535 | $3,395 | $35,140 |
Source: Public Records
Map
Nearby Homes
- 3129 McGuffey Rd
- 3147 Grasmere Ave
- 1285 E North Broadway St
- 3043 McGuffey Rd
- 3071 Karl Rd
- 3029 McGuffey Rd
- 3107 Hamilton Ave
- 3268 McGuffey Rd
- 1247 Weldon Ave
- 2950 Grasmere Ave
- 1126 Piedmont Rd
- 1212 Abner Ave
- 2913 Gerbert Rd
- 1181 Lenore Ave
- 2905 Ontario St
- 2899 Howey Rd
- 2888 Howey Rd
- 3134 Medina Ave
- 3056 Medina Ave
- 2860 Grasmere Ave
- 1197 E North Broadway St Unit 199
- 3139 McGuffey Rd
- 3151 McGuffey Rd
- 3125 McGuffey Rd
- 3157 McGuffey Rd
- 3148 Grasmere Ave
- 3142 Grasmere Ave
- 3121 McGuffey Rd
- 3138 Grasmere Ave
- 3156 Grasmere Ave
- 1219 E North Broadway St
- 3132 Grasmere Ave
- 3162 Grasmere Ave Unit 164
- 3165 McGuffey Rd
- 3115 McGuffey Rd
- 1220 E North Broadway St
- 3126 McGuffey Rd
- 3126 Grasmere Ave
- 3168 Grasmere Ave
- 0 McGuffey Rd