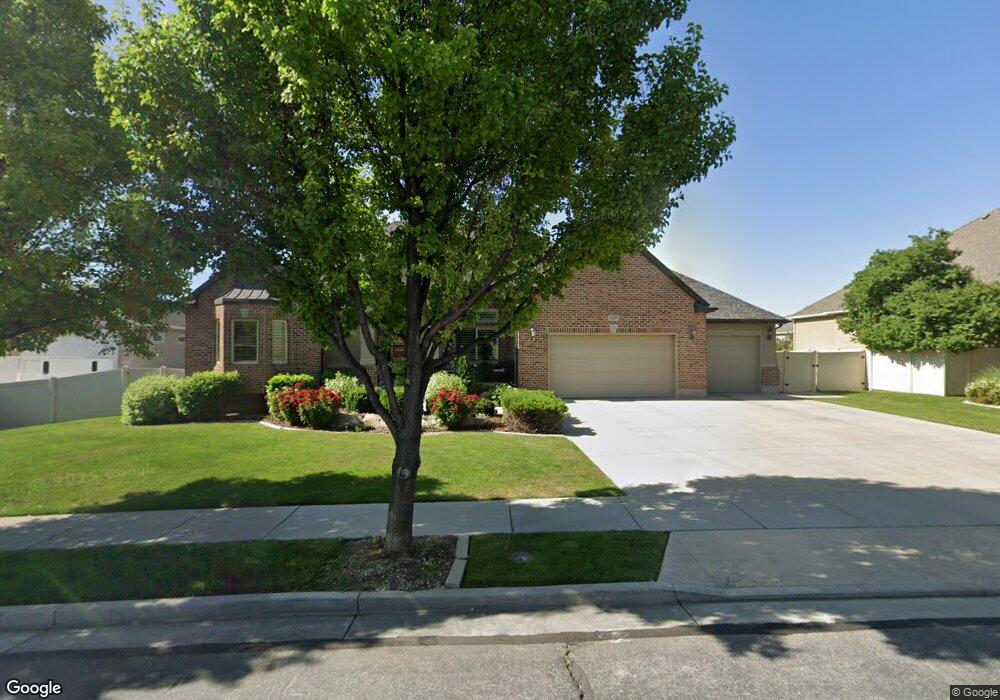
3137 W Blaze Meadows Rd South Jordan, UT 84095
Estimated Value: $1,048,000 - $1,087,000
5
Beds
4
Baths
5,170
Sq Ft
$206/Sq Ft
Est. Value
About This Home
This home is located at 3137 W Blaze Meadows Rd, South Jordan, UT 84095 and is currently estimated at $1,067,058, approximately $206 per square foot. 3137 W Blaze Meadows Rd is a home located in Salt Lake County with nearby schools including Monte Vista Elementary School, South Jordan Middle School, and Mountain West Montessori Academy.
Ownership History
Date
Name
Owned For
Owner Type
Purchase Details
Closed on
May 27, 2025
Sold by
Brent Menlove Living Trust and Menlove Brent
Bought by
Paula Menlove Living Trust and Menlove
Current Estimated Value
Purchase Details
Closed on
May 24, 2023
Sold by
Menlove Paula J
Bought by
Paula Menlove Living Trust and Brent Menlove Living Trust
Purchase Details
Closed on
Aug 14, 2020
Sold by
Thurgood J Rand and The Rand And Tauna Thurgood Li
Bought by
Menlove Brent J and Menlove Paula J
Home Financials for this Owner
Home Financials are based on the most recent Mortgage that was taken out on this home.
Original Mortgage
$600,000
Interest Rate
3%
Mortgage Type
New Conventional
Purchase Details
Closed on
Apr 4, 2006
Sold by
Thurgood James Rand and Thurgood Tauna
Bought by
Thurgood J Rand and Thurgood Tauna
Create a Home Valuation Report for This Property
The Home Valuation Report is an in-depth analysis detailing your home's value as well as a comparison with similar homes in the area
Home Values in the Area
Average Home Value in this Area
Purchase History
| Date | Buyer | Sale Price | Title Company |
|---|---|---|---|
| Paula Menlove Living Trust | -- | None Listed On Document | |
| Paula Menlove Living Trust | -- | None Listed On Document | |
| Paula Menlove Living Trust | -- | None Listed On Document | |
| Menlove Brent J | -- | Gt Title Services Slc | |
| Thurgood J Rand | -- | Surety Title | |
| Thurgood James Rand | -- | Surety Title |
Source: Public Records
Mortgage History
| Date | Status | Borrower | Loan Amount |
|---|---|---|---|
| Previous Owner | Menlove Brent J | $600,000 |
Source: Public Records
Tax History Compared to Growth
Tax History
| Year | Tax Paid | Tax Assessment Tax Assessment Total Assessment is a certain percentage of the fair market value that is determined by local assessors to be the total taxable value of land and additions on the property. | Land | Improvement |
|---|---|---|---|---|
| 2025 | $5,344 | $1,063,400 | $273,300 | $790,100 |
| 2024 | $5,344 | $1,014,700 | $260,300 | $754,400 |
| 2023 | $5,344 | $953,300 | $252,700 | $700,600 |
| 2022 | $5,446 | $956,300 | $247,700 | $708,600 |
| 2021 | $4,380 | $705,700 | $204,800 | $500,900 |
| 2020 | $4,265 | $644,100 | $204,800 | $439,300 |
| 2019 | $4,267 | $633,300 | $193,800 | $439,500 |
| 2018 | $0 | $601,100 | $192,700 | $408,400 |
| 2017 | $4,001 | $579,100 | $189,400 | $389,700 |
| 2016 | $4,146 | $568,600 | $175,100 | $393,500 |
| 2015 | $4,066 | $542,200 | $176,700 | $365,500 |
| 2014 | $3,788 | $496,400 | $168,500 | $327,900 |
Source: Public Records
Map
Nearby Homes
- 3168 Chalk Creek Way
- 2817 W 11460 St S Unit 203
- 3371 W Waterbridge Cove Unit 417
- 2732 W Lizzi Cove
- 3028 W Wilkins Peak Ct
- 3376 W Water Crescent Place
- 3407 W Pazos Cir Unit 4
- 2626 W Midas Side Way
- 2602 W 11625 S
- 11716 S 2610 W
- 11513 S Jackson Downs Way
- 3550 W Franco Court #2
- 3537 W Sojo Dr
- 11527 S 3600 W
- 11159 Via Encantada Way
- 2853 W 12075 S
- 3558 W Via Bello Ct
- 2410 W 11400 S
- 3644 W Harvest Gold Way
- 11881 S Harvest Gold Way
- 3137 Blaze Meadows Rd
- 3149 Blaze Meadows Rd
- 3056 W Rolling Creek Way
- 3092 W Rolling Creek Way
- 3067 Blaze Meadows Rd
- 11563 Field Haven Way
- 11563 S Field Haven Way
- 3169 Blaze Meadows Rd
- 11562 Tara Woods Ln
- 3138 W Rolling Creek Way
- 3024 W Rolling Creek Way
- 3083 W Rolling Creek Way
- 3158 Blaze Meadows Rd
- 11551 S Field Haven Way
- 11558 Field Haven Way
- 11551 Field Haven Way
- 3172 W Blaze Meadows Rd
- 3033 W Rolling Creek Way
- 3183 Blaze Meadows Rd
- 11629 S Water Brook Ct