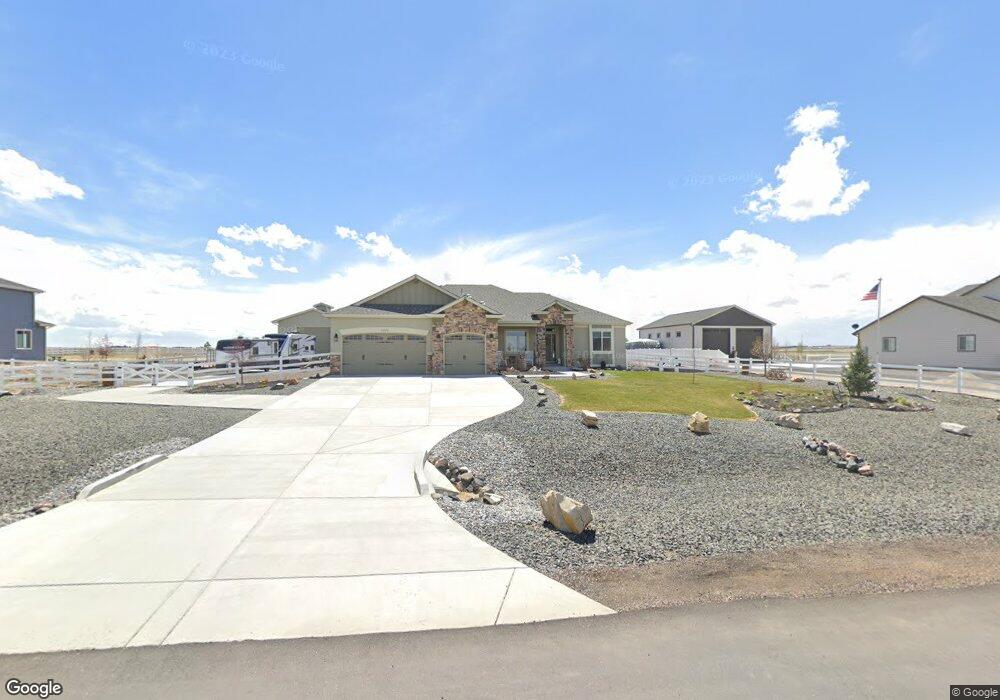
31370 E 161th Ct Hudson, CO 80642
Box Elder Creek Ranch NeighborhoodEstimated Value: $706,000 - $851,000
3
Beds
2
Baths
2,006
Sq Ft
$396/Sq Ft
Est. Value
About This Home
This home is located at 31370 E 161th Ct, Hudson, CO 80642 and is currently estimated at $795,202, approximately $396 per square foot. 31370 E 161th Ct is a home located in Adams County with nearby schools including Overland Trail Middle School and Brighton High School.
Ownership History
Date
Name
Owned For
Owner Type
Purchase Details
Closed on
Mar 19, 2024
Sold by
Lubick John T and Lubick Shelley K
Bought by
Mann Paul Robert and Mann Susan Jean
Current Estimated Value
Home Financials for this Owner
Home Financials are based on the most recent Mortgage that was taken out on this home.
Original Mortgage
$766,549
Outstanding Balance
$751,510
Interest Rate
6.88%
Mortgage Type
New Conventional
Estimated Equity
$43,693
Purchase Details
Closed on
Nov 7, 2017
Sold by
B P H Construction Corp
Bought by
Lubick John T and Lubick Shelley K
Home Financials for this Owner
Home Financials are based on the most recent Mortgage that was taken out on this home.
Original Mortgage
$457,083
Interest Rate
3.83%
Mortgage Type
New Conventional
Purchase Details
Closed on
May 25, 2016
Sold by
Meadow Homes Development Corp
Bought by
B P H Construction Corp
Purchase Details
Closed on
Oct 18, 1995
Sold by
Hemco Inc
Bought by
Cooper Kelly R and Cooper Maureen C
Create a Home Valuation Report for This Property
The Home Valuation Report is an in-depth analysis detailing your home's value as well as a comparison with similar homes in the area
Home Values in the Area
Average Home Value in this Area
Purchase History
| Date | Buyer | Sale Price | Title Company |
|---|---|---|---|
| Mann Paul Robert | $825,000 | Land Title Guarantee | |
| Lubick John T | $481,140 | Chicago Title Co | |
| B P H Construction Corp | $66,000 | Land Title Guarantee Co | |
| Cooper Kelly R | $167,027 | -- |
Source: Public Records
Mortgage History
| Date | Status | Borrower | Loan Amount |
|---|---|---|---|
| Open | Mann Paul Robert | $766,549 | |
| Previous Owner | Lubick John T | $457,083 |
Source: Public Records
Tax History
| Year | Tax Paid | Tax Assessment Tax Assessment Total Assessment is a certain percentage of the fair market value that is determined by local assessors to be the total taxable value of land and additions on the property. | Land | Improvement |
|---|---|---|---|---|
| 2025 | $7,552 | $50,660 | $10,200 | $40,460 |
| 2024 | $7,552 | $46,570 | $9,380 | $37,190 |
| 2023 | $7,510 | $52,090 | $7,440 | $44,650 |
| 2022 | $5,935 | $38,510 | $6,390 | $32,120 |
| 2021 | $5,706 | $38,510 | $6,390 | $32,120 |
| 2020 | $5,388 | $37,830 | $5,010 | $32,820 |
| 2019 | $5,401 | $37,830 | $5,010 | $32,820 |
| 2018 | $4,589 | $31,000 | $5,040 | $25,960 |
| 2017 | $2,304 | $15,710 | $15,710 | $0 |
| 2016 | $1,136 | $7,950 | $7,950 | $0 |
| 2015 | $596 | $4,200 | $4,200 | $0 |
| 2014 | $591 | $4,200 | $4,200 | $0 |
Source: Public Records
Map
Nearby Homes
- 31501 E 161st Ct
- 31460 E 162nd Ave
- 30460 E 161st Ave
- 16525 Queensview St
- 16525 Queensview St Unit 60
- 30300 E 162nd Ave
- 30355 E 161st Ave
- 30400 E 162nd St Unit corner
- 31505 E 166th Ave
- 30315 E 161st Ave
- 16540 Umpire St
- 30045 E 161st Ave
- 29980 E 161st Ave
- 30185 E 166th Ave
- 29775 E 162nd Ave
- 16143 Kenosha Ct
- 16125 Kenosha Ct Unit corner
- 16157 Kenosha Ct
- 30959 E 151st Ave
- 29585 E 165th Ave
- 31370 E 161st Ct
- 31440 E 161th Ct
- 31330 E 160th Ave
- 31330 E 161st Ct
- 31440 E 161st Ct
- 31407 E 160th Ave
- 31367 E 160th Ave
- 31480 E 141st Ct
- 31480 E 161th Ct
- 31381 E 161st Ct
- 31480 E 161st Ct
- 31431 E 161st Ct
- 31381 E 161st Ct
- 31381 E 161th Ct
- 31431 E 161th Ct
- 31341 E 161th Ct
- 31341 E 161st Ct
- 31471 E 161th Ct
- 31471 E 161st Ct Unit 9
- 31471 E 161st Ct
Your Personal Tour Guide
Ask me questions while you tour the home.